4 · Measurements, trends, and alarms#
This chapter shows you how to read a point’s trends, dig into a vibration reading’s waveform and spectrum, record what you conclude, set alarm limits, and trust the single, reliable state Mechbase derives from a stream of readings — the part that keeps the whole system worth paying attention to.
Reading a trend#
Every measurement point has a Trend — its readings plotted over time. It’s the single most useful view for spotting a problem early, because a value that looks fine on its own often tells a clear story once you see where it’s heading.
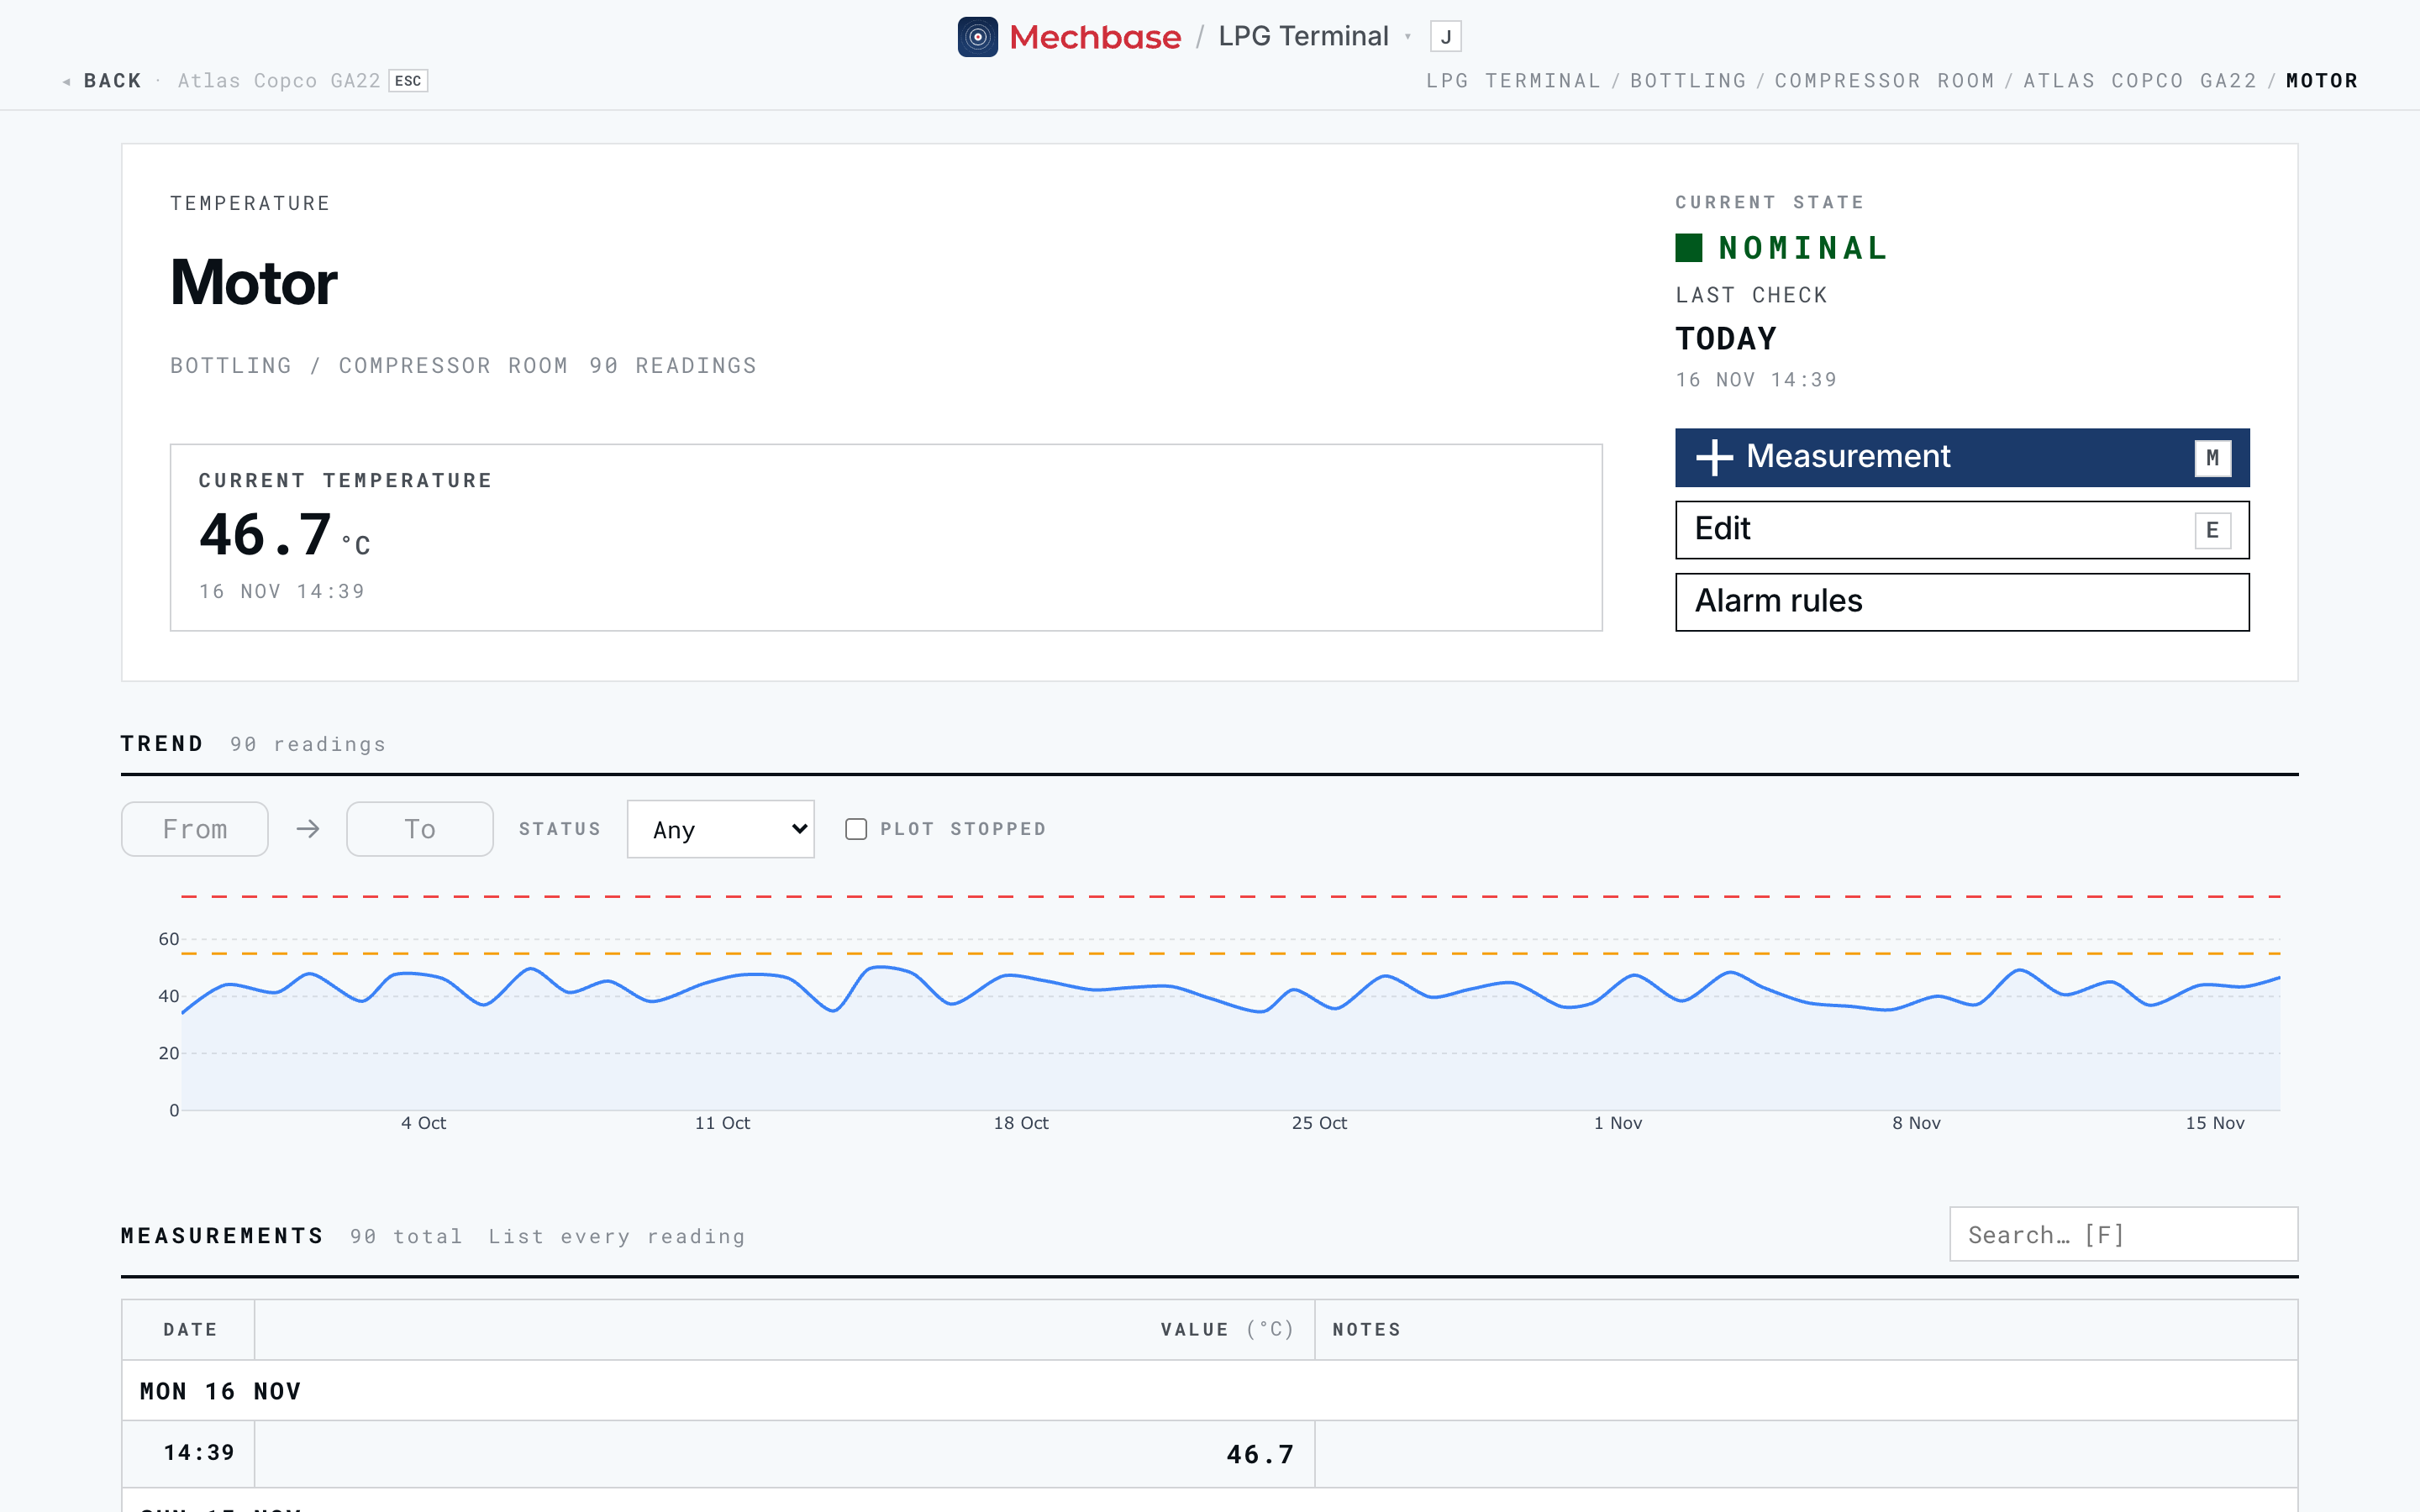
For most points — temperature, pressure, ultrasound — the trend is one chart:
The line is the reading over time. You’re looking for direction and pattern — a steady climb, a step change, a new wobble — as much as the latest number.
The dashed limits are the alarm thresholds: amber for warning, red for critical. How much headroom there is between the line and those limits tells you how hard the equipment is being pushed.
Vibration points show a grid of small charts instead — one per metric (Acc RMS, Peak, Vel 10Hz, Vel 2Hz, O-P, P-P, CF, Kurt), each spanning the week up to the latest reading. The metric the alarm watches carries its limits. Under each chart, normal gives the band the value usually sits in — the middle 80% of running readings over the previous 30 days — so you can tell at a glance whether today is unusual for this machine, not just whether it’s under a limit. Hover any chart and a cursor follows on all of them; click a point to inspect that reading below.
When the machine has a tachometer, the grid adds Speed, 1X, 1X phase, 2X, and 2X phase. Each of these has a Time | RPM toggle: against RPM it becomes a run-up/coast-down (Bode) plot, where a resonance shows as a peak in amplitude with a swing in phase.
Remember that the units on every axis are your units, set in your profile
(Getting started) — the same data reads in Hz/mm/s or
CPM/in/s depending on who’s looking.
Filters and time range#
The controls above the trend let you focus on exactly the readings you care about:
From → To — set a date range to zoom into a specific period, like the week a problem started.
Status — show only readings of a given state (Nominal, Check, Warning, or Critical). Handy for jumping straight to every warning-level reading.
Waveforms only (vibration) — only readings that carry a full waveform.
Plot stopped (most other types) — by default the chart skips readings taken while the machine was stopped, and tells you how many it left out (“N readings taken while the machine was stopped are not plotted. Plot them”). Tick it to show them. On vibration charts, stopped readings are always shown, faintly.
The readings table#
Below the chart, Measurements lists the readings in the chosen range, newest first, under a heading per day. Instead of hundreds of near-identical rows, Mechbase folds each stretch of one machine state into a run: “06:00 → 14:00 · Running · 48 readings”, with the low, typical, and high value and the worst state. Click a run to expand its readings. List every reading switches to a plain list; Group by run switches back.
The columns follow the point’s type: for vibration, RMS, Peak, Vel, and
CF; for ultrasound, the Level in dB; for thermography, a thumbnail, the
Max temperature, ΔT, and the number of Hotspots; for everything else,
the Value. Readings taken while the machine was stopped stay in the list,
marked Stopped. The search box (F) finds readings by their notes.
Click a vibration reading to inspect it in place; click any other reading to open its own page.
Inspecting a vibration reading#
For vibration, a single number isn’t enough to diagnose a fault. Mechbase keeps the full waveform behind each reading, and the Inspect panel on the point page lets you look at it without leaving the trend. It opens on the latest running reading; click any point on the charts above to switch.
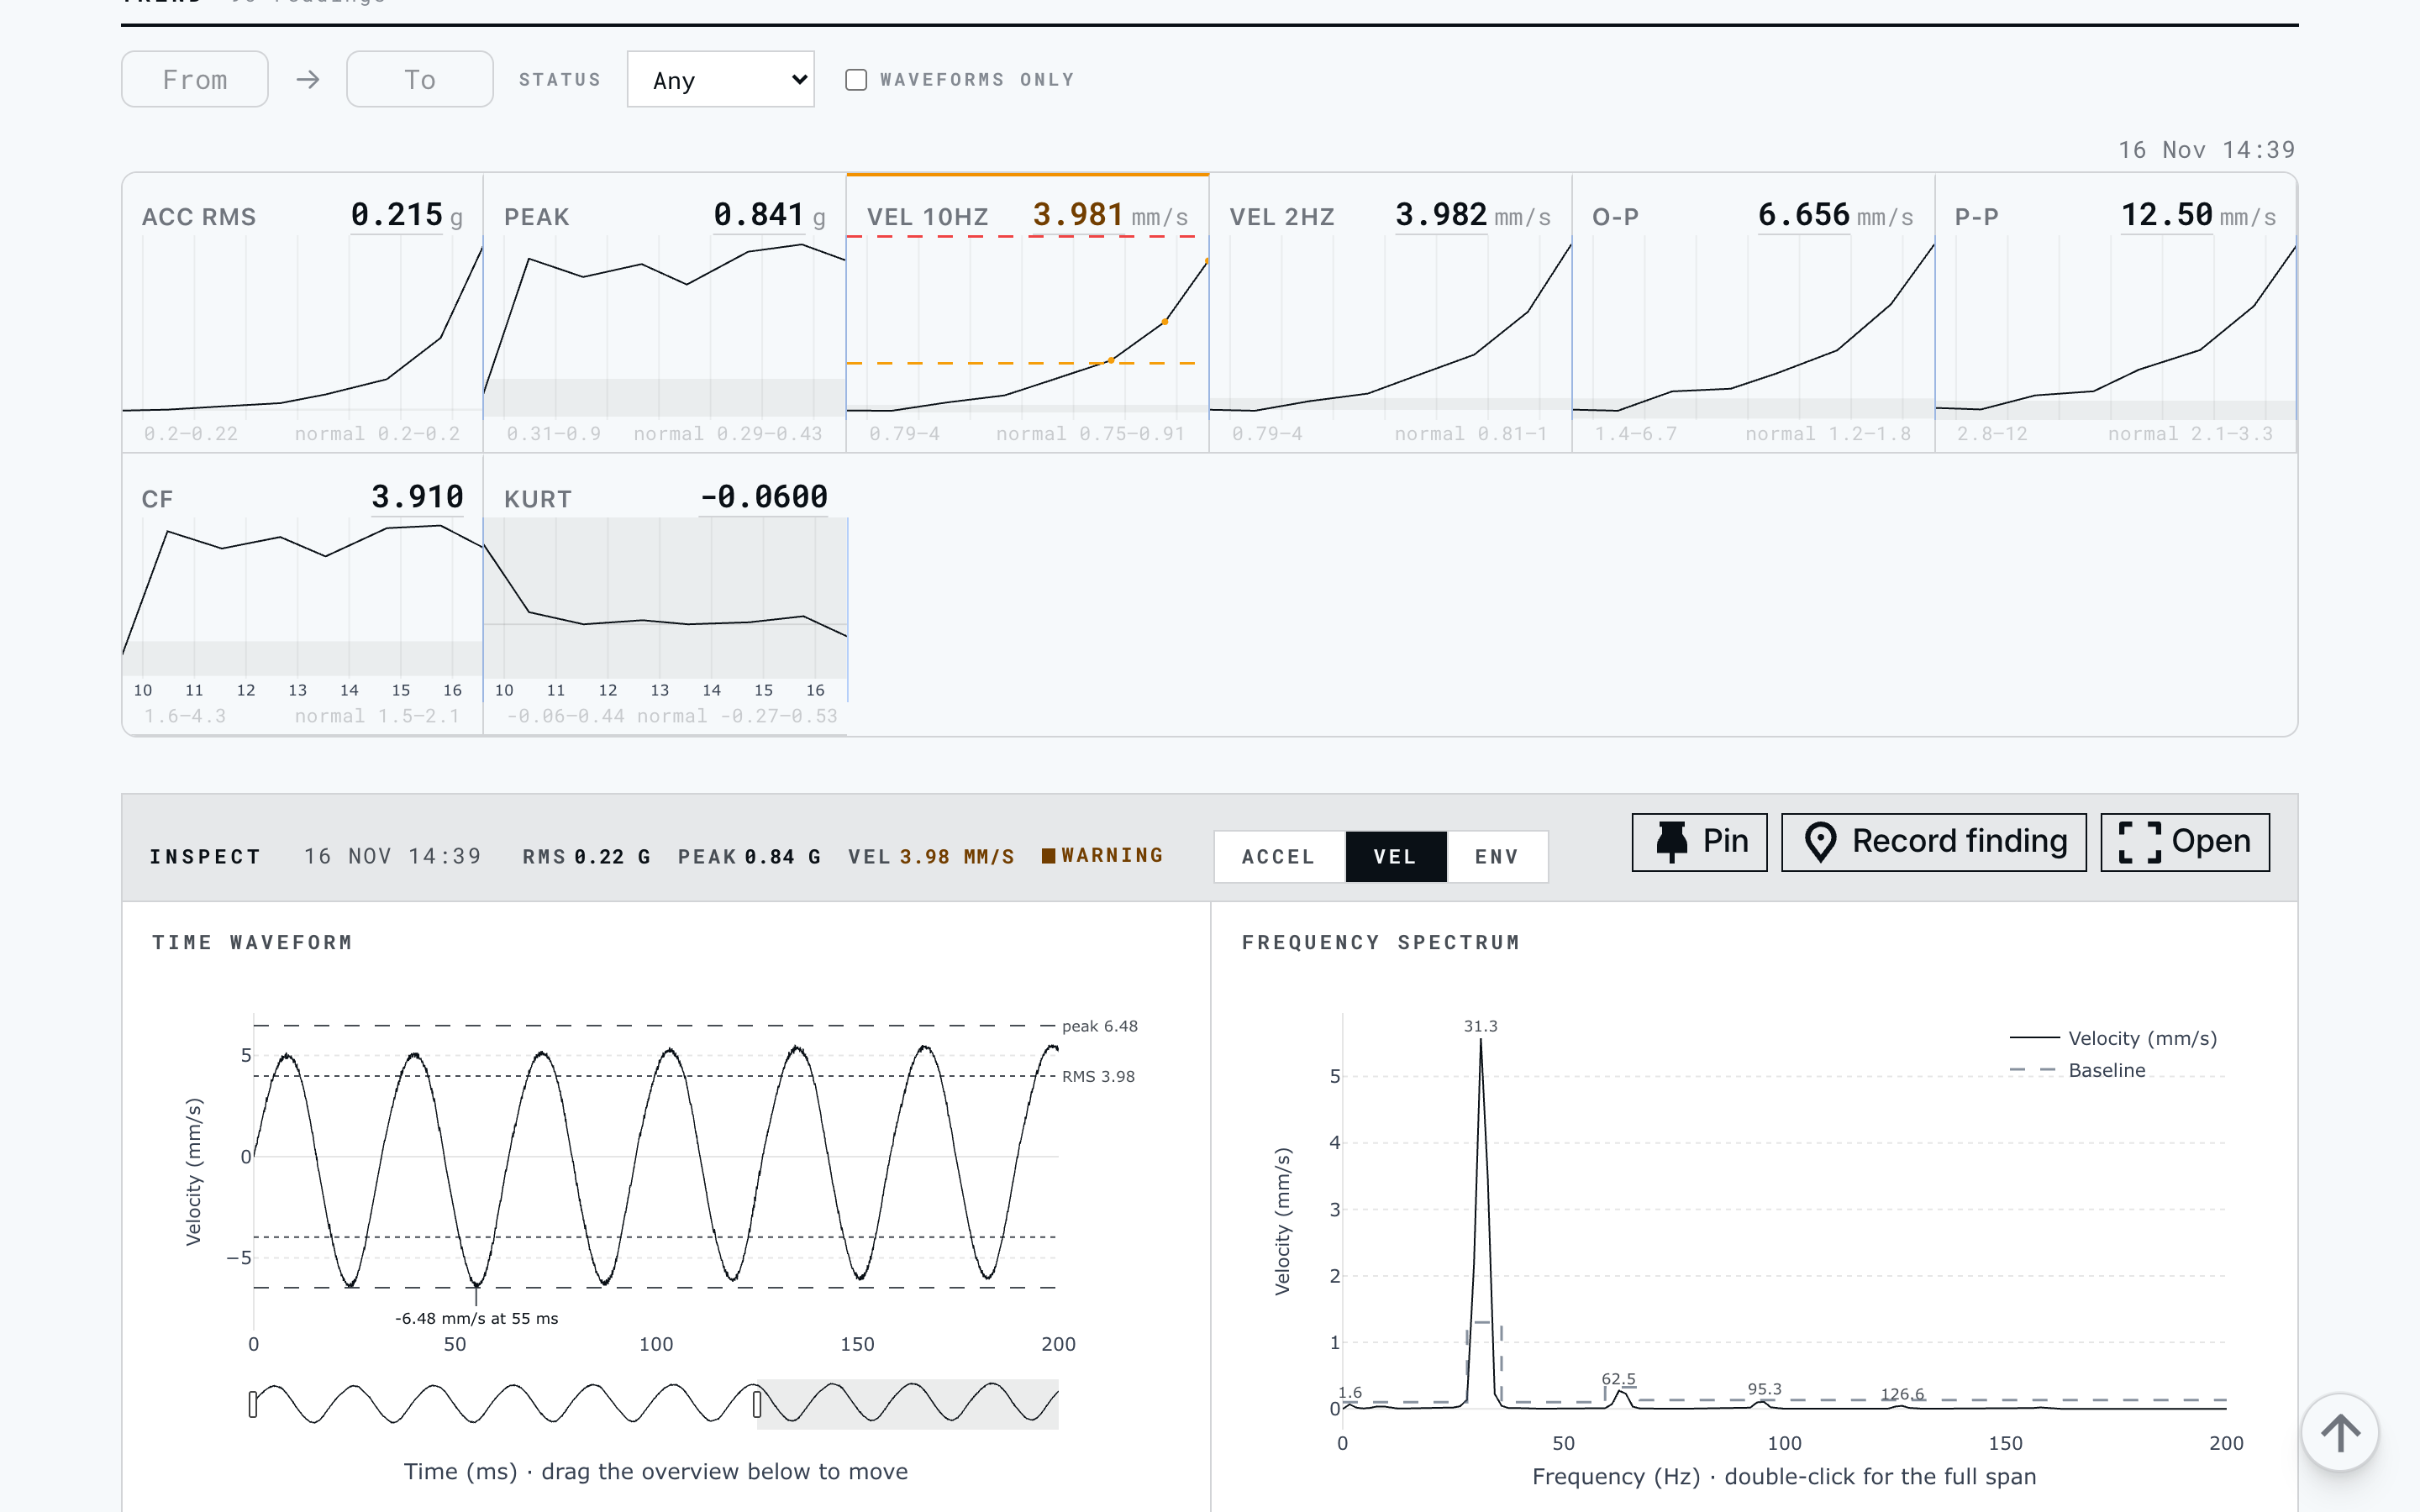
The panel’s header repeats the reading’s key values (RMS, Peak, Vel) and its state. If the reading came with a tachometer, it adds the shaft speed and the 1X and 2X amplitude and phase (“1X 2.1 mm/s ∠ 47°”); a phase Mechbase doesn’t trust — because the speed wandered during the capture — is shown muted with the reason.
Accel / Vel / Env — switch both charts between acceleration, velocity, and the demodulated envelope (for bearing defects).
Time waveform — opens on about four shaft revolutions (or 200 ms without a tachometer), with ±RMS and the peak marked and the largest excursion flagged. Tachometer pulses appear as tick marks. Drag the overview strip underneath to move along the capture. One rev folds the signal into a single averaged revolution with its 1X fit — the clearest view of unbalance and looseness.
Frequency spectrum — opens zoomed on the band that holds almost all the energy, with the five largest peaks labelled. Hz | Orders switches the axis to multiples of shaft speed, with 1X–10X order lines drawn in. Double-click for the full span. If a bearing is assigned to the point, its defect frequencies are marked too (Bearings).
Pin — keep the reading for side-by-side comparison (Comparing readings).
Record finding — write down your diagnosis (Recording a finding).
Open — go to the reading’s own page.
If the spectrum shows a strong tone that looks like a bearing but the point has no bearing assigned, Mechbase points it out — “Possible bearing tone at 3.58×” — with an Assign bearing button that lists the library bearings matching that tone. Nothing is assigned until you choose.
A single reading’s page#
Every reading has its own page — open it from Open in the inspect panel, from the readings table, or from a route report.
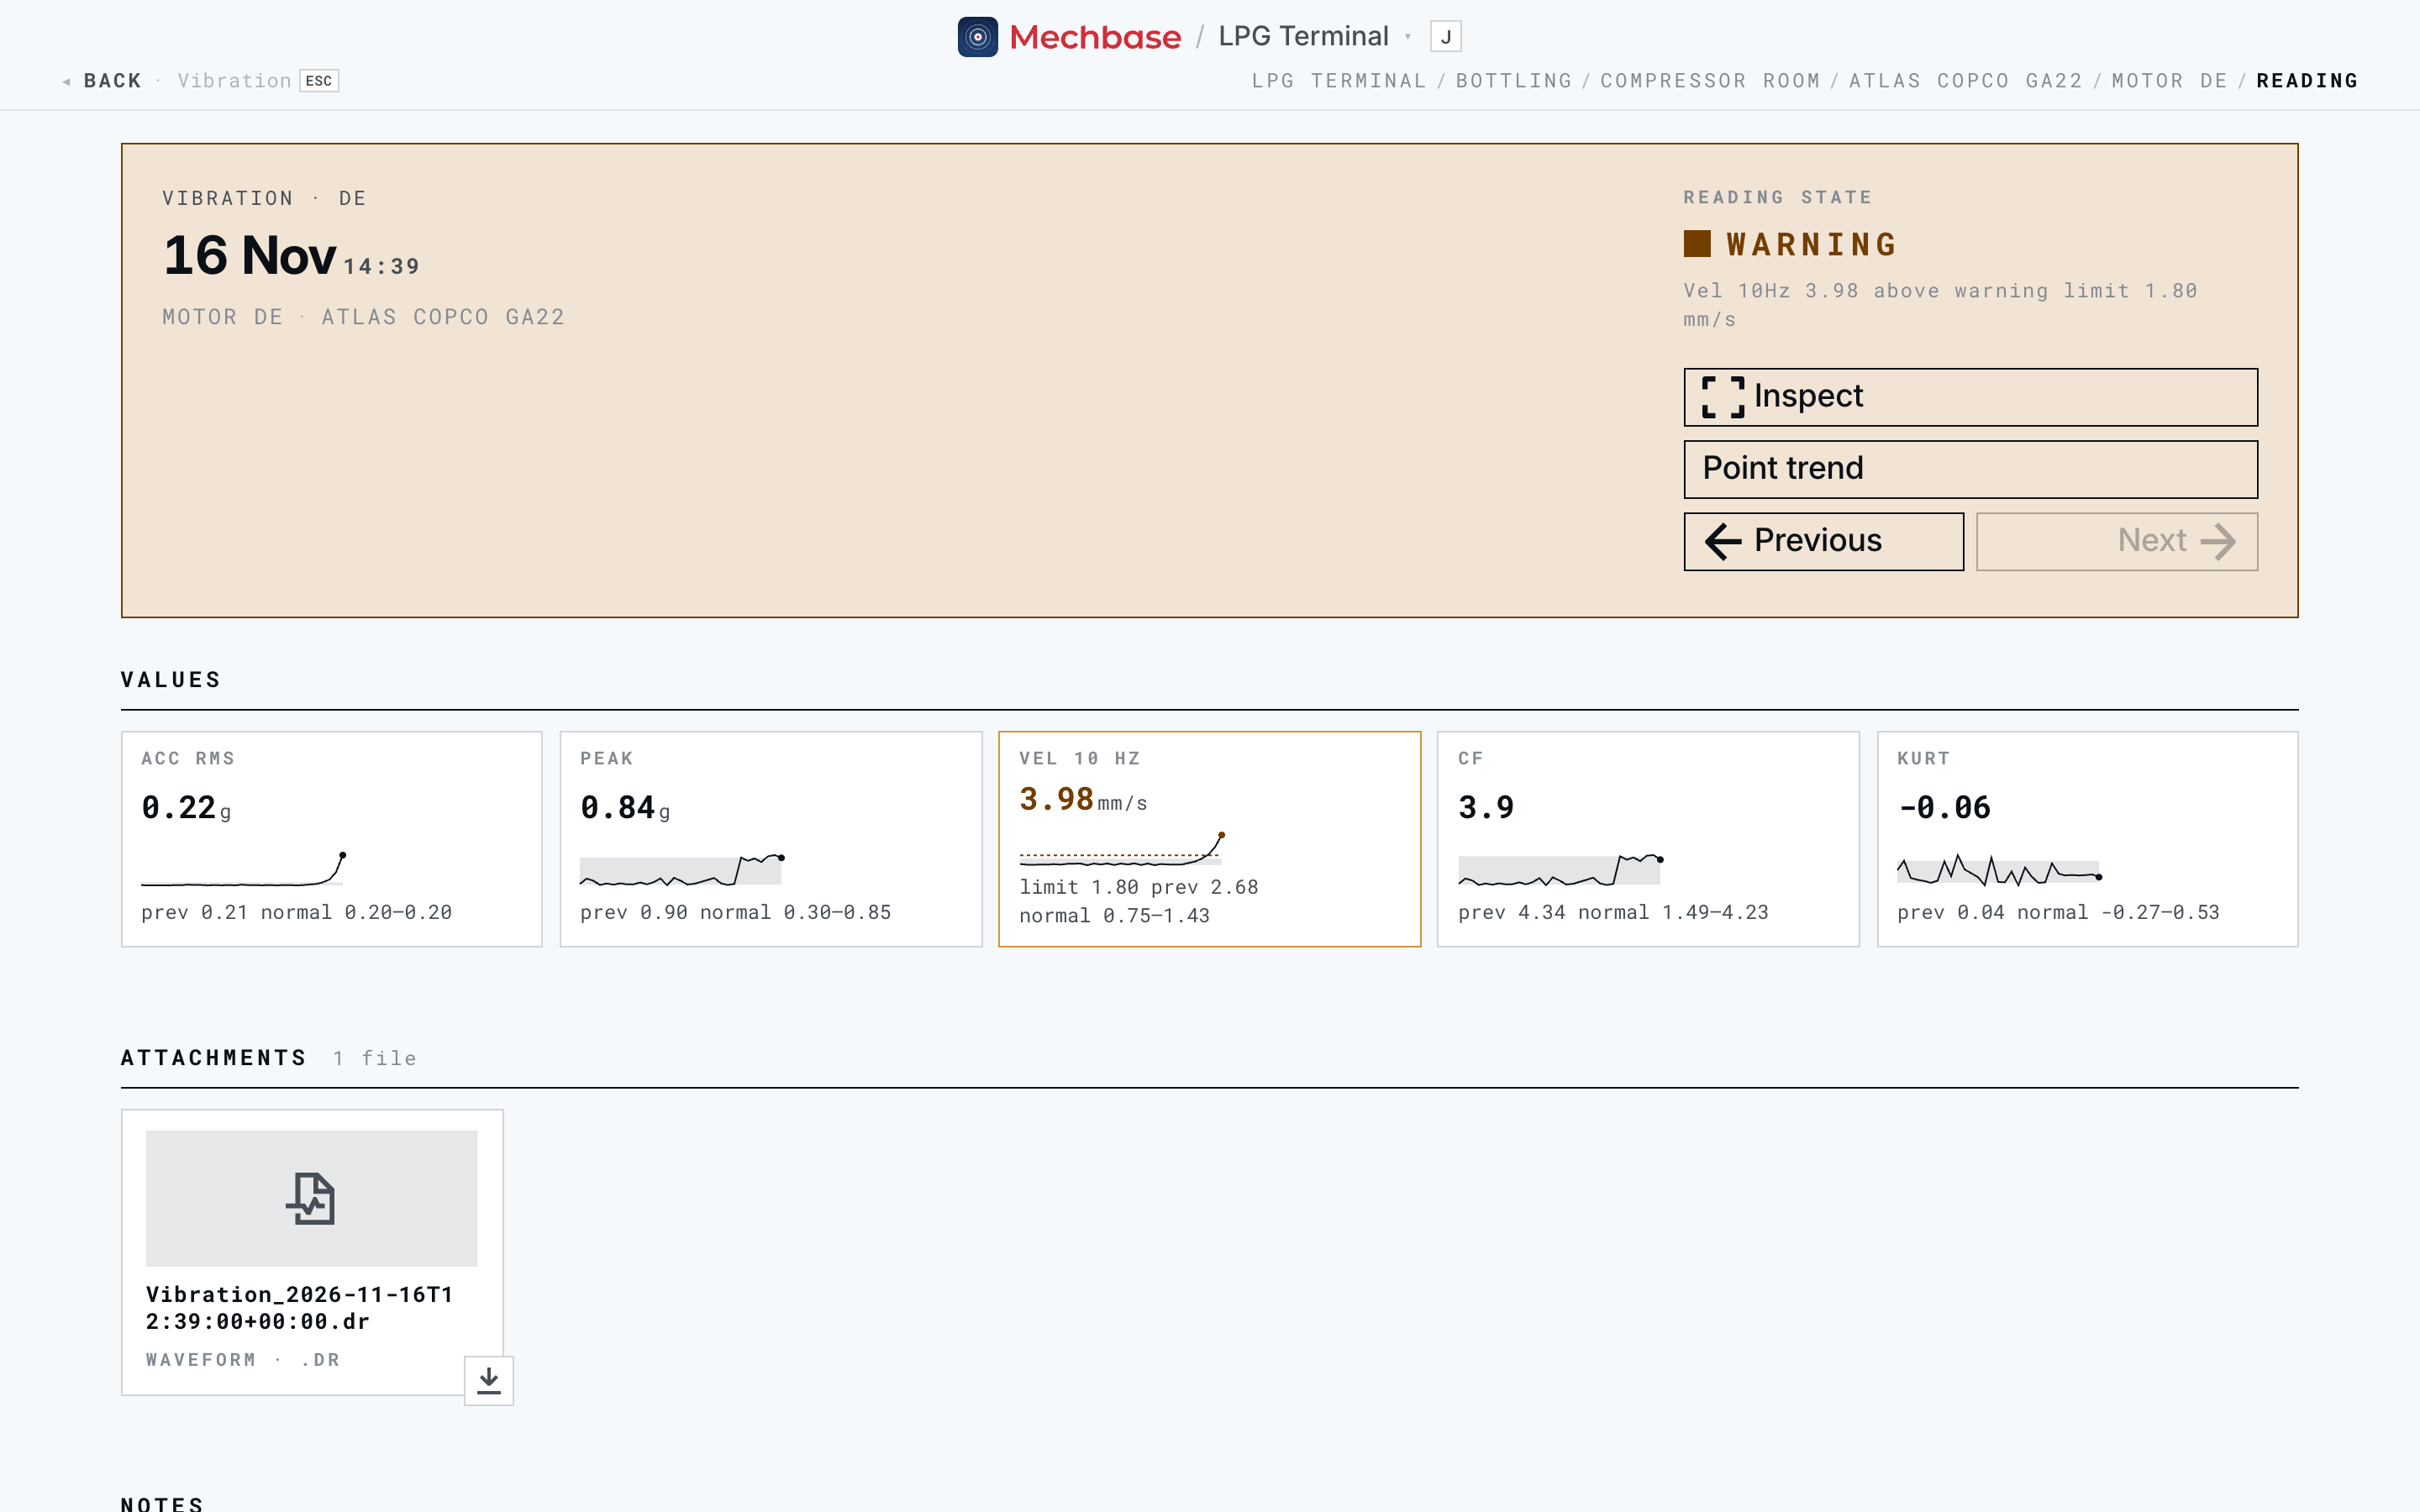
The header shows the reading’s state and, if it’s in alarm, why (“Vel 10Hz 3.98 above warning limit 1.80 mm/s”), with who recorded it and how (a MaintNode, a route, or by hand). Previous and Next step through the point’s readings; Point trend goes back to the point.
Values — every value in context: a small trend of the last 40 running readings, the normal band, the limit, and a line comparing it with the limit, the previous reading, and the normal band (“limit 1.80 · prev 2.68 · normal 0.79–1.43”).
Attachments — the files that came with the reading: the raw waveform (
.dr), photos, and thermograms with their hotspots. Click to download.Notes — add a note to the record.
For vibration, Bench gives you the waveform and spectrum with a little more control: choose the Signal (Accel, Vel, or Env), set a High-pass and Low-pass filter in Hz, and click Apply (or Reset).
Delete reading removes it straight away — no “Are you sure?” — and shows an Undo button for a few seconds in case it was a slip. The point’s state is recalculated from the readings that remain.
Comparing readings#
To compare readings — before and after a repair, this month against last — click Pin on each one in the inspect panel. The pinned readings collect in a tray; click Analyze to open the Compare drawer along the bottom of the page.
In the drawer you can switch between Velocity, Accel, Envelope, and Waveform, apply a high/low-pass filter, overlay the readings, show the spectrum in dB, label the Top peaks, and add harmonic cursors at a frequency you choose. Record finding works from here too.
Recording a finding#
A finding is an analyst’s conclusion about a reading — what’s wrong, how serious it is, and what to do — written down where everyone can see it, and in a form a maintenance system can pick up.
Click Record finding on the inspect panel (or in the Compare drawer). If you clicked a peak in the spectrum first, its frequency, amplitude, and any matching defect (“148.3 Hz · 2.31 mm/s · 3.05× · BPFO”) are attached as evidence.
Fault — Bearing outer race (BPFO), inner race (BPFI), rolling element (BSF), cage (FTF), Unbalance, Misalignment, Looseness, or Other. Mechbase suggests one from the peak you clicked.
Severity — Check, Warning, or Critical.
Action — what to do (“Replace DE bearing”), and a Due by date.
Comment — what you see, in your own words.
Click Record finding. It’s added to the asset’s notes as a card with the severity, fault, action, due date, and evidence, and it appears in the activity feed. A finding can be edited but not deleted — it’s part of the record.
Findings also have a work-order lifecycle — Open, Acknowledged, Closed — that your CMMS moves along through the API, attaching its work-order number (see the Analytics & BI and integration cookbooks).
Bearings and defect frequencies#
When a vibration point knows which bearing it’s watching, Mechbase can mark the bearing’s defect frequencies on every spectrum, trend each defect band, and alarm on them.
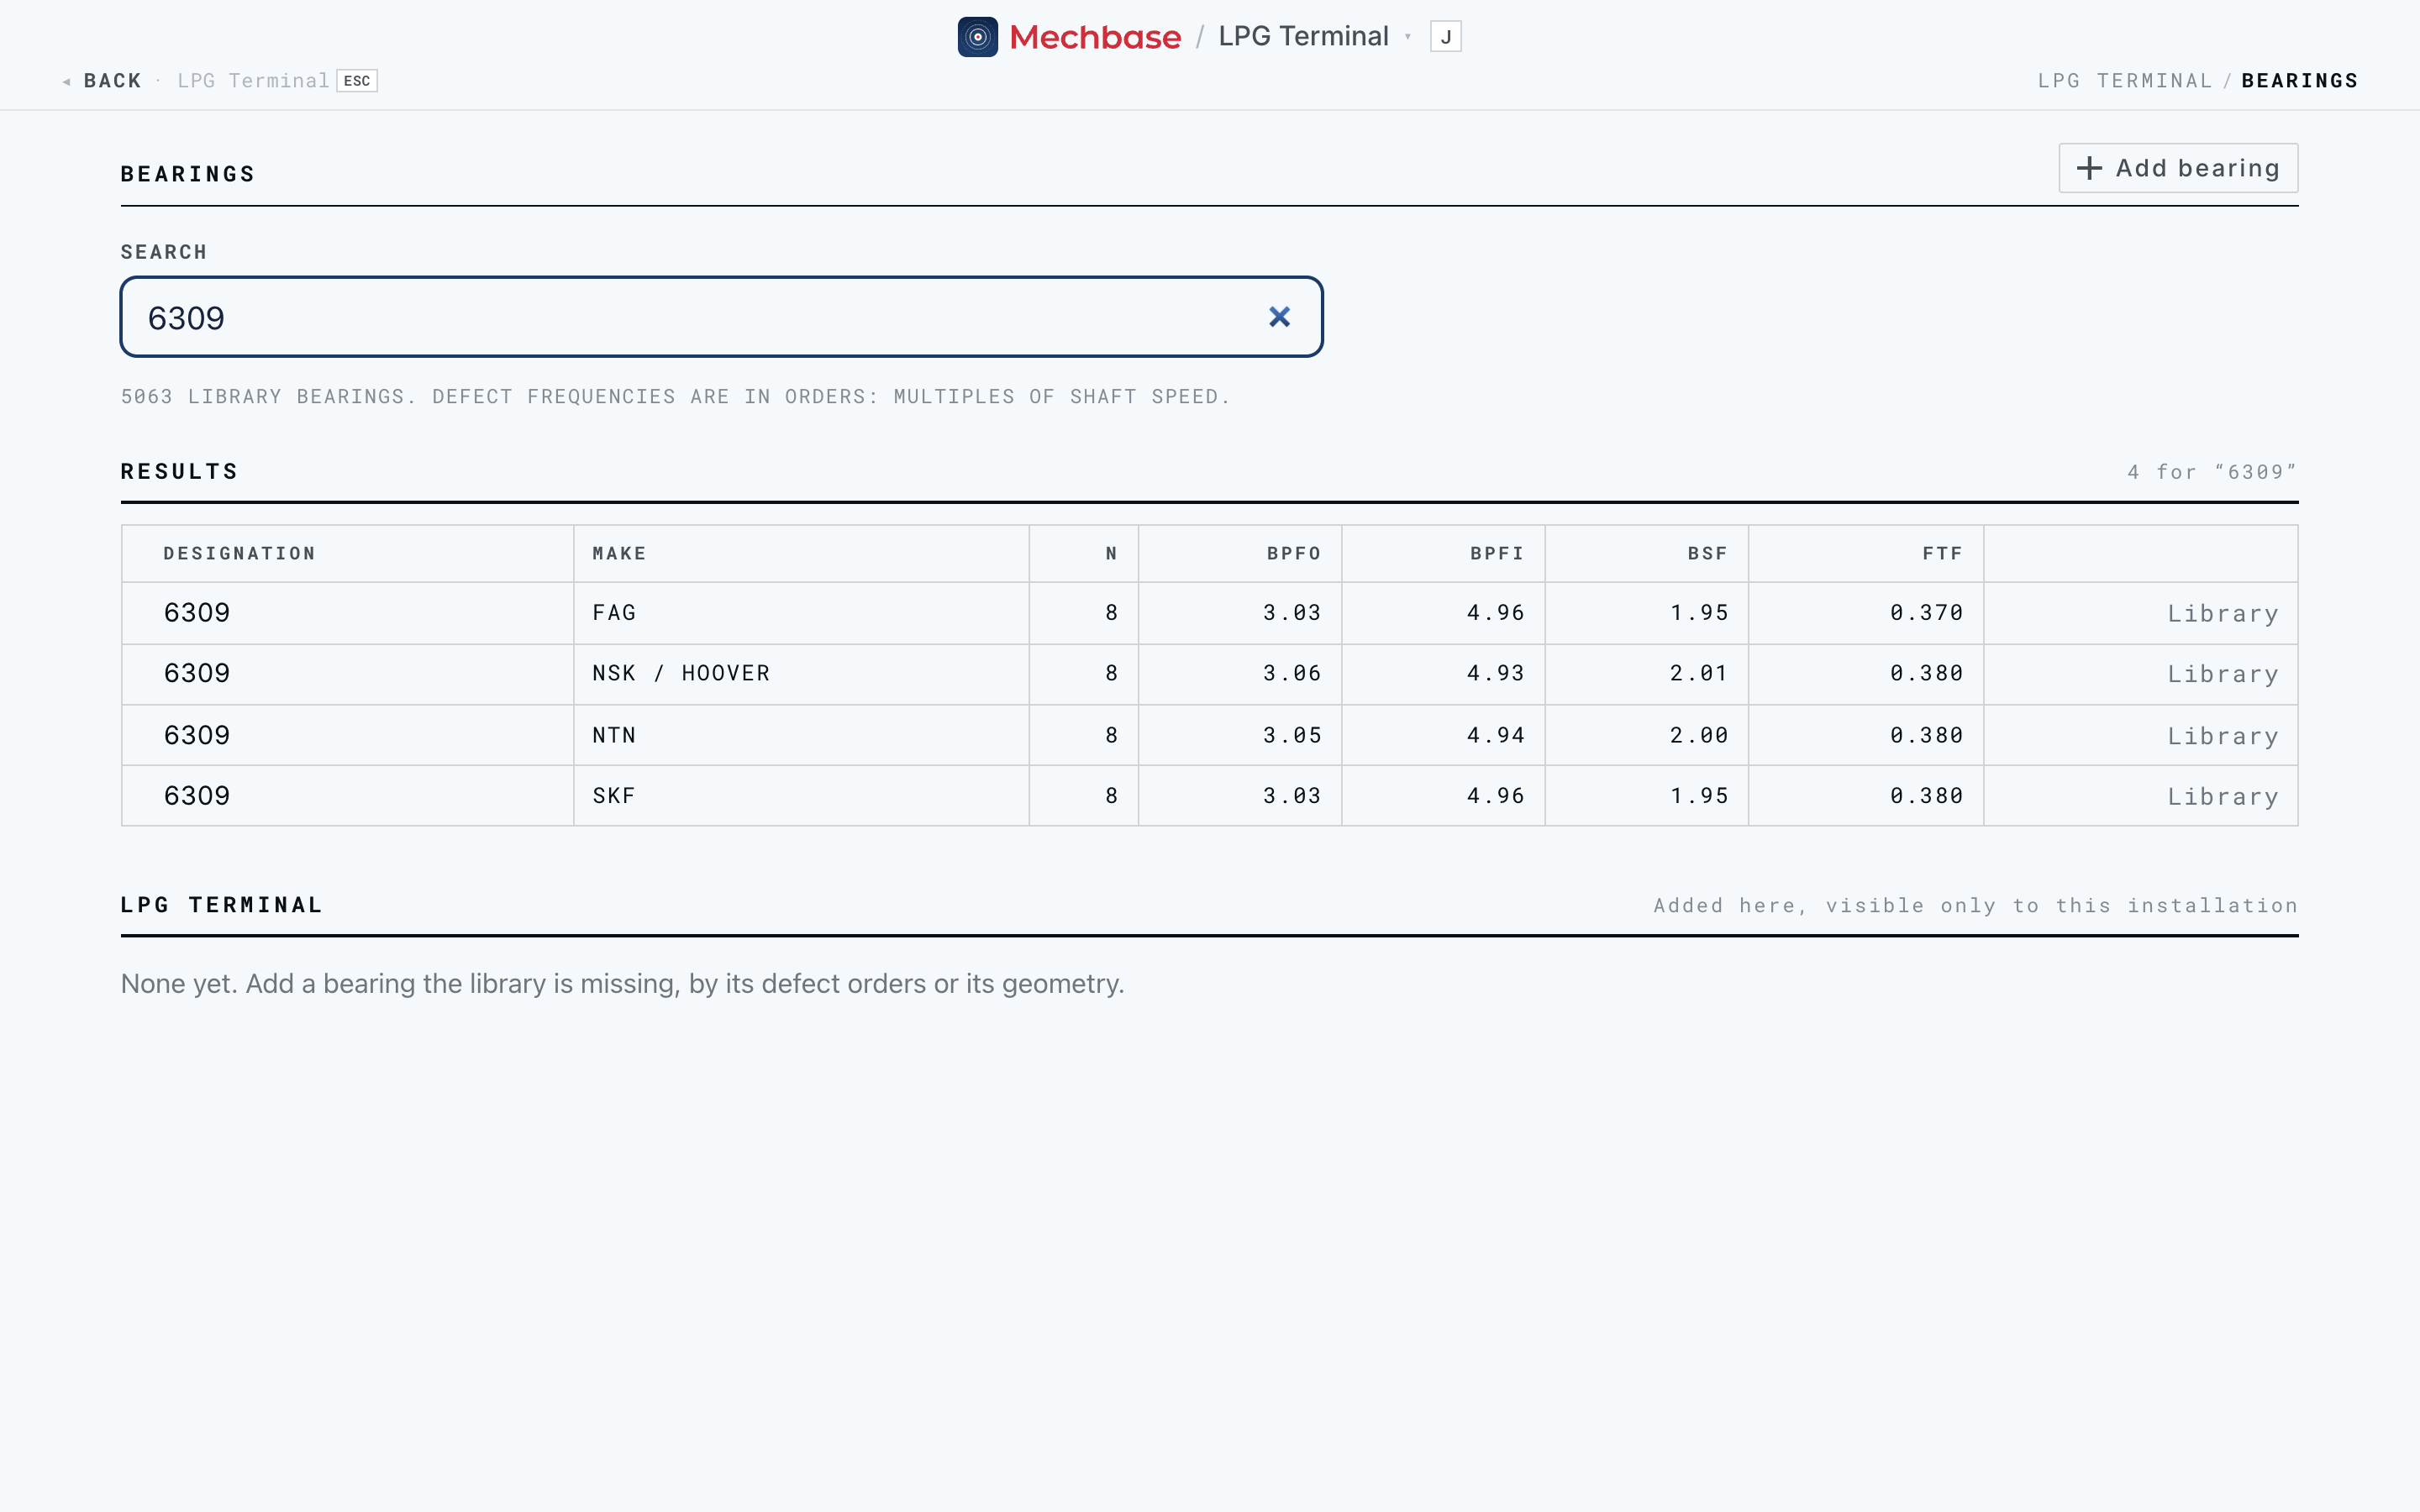
The library. Open Bearings from the menu (Setup → Bearings). Mechbase
carries a library of several thousand rolling-element bearings. Search by
designation or maker (“6309”, “SKF 6205”) — press F to jump to the search box.
Each result shows the number of rolling elements and the four defect frequencies,
in orders (multiples of shaft speed):
BPFO — outer-race defect.
BPFI — inner-race defect.
BSF — ball spin.
FTF — cage (fundamental train).
Your own bearings. If the library is missing one, click Add bearing. Give its Designation, Manufacturer, and Rolling elements, then either the four Defect orders from the maker’s data, or its Geometry (ball diameter, pitch diameter, contact angle) and let Mechbase work the orders out. Bearings you add are visible only to your installation.
Assigning one to a point. Edit the point and, under Shaft & bearing, set the Nominal speed, search for the Bearing, and set a Speed ratio if it sits behind a gearbox or belt. From then on:
Spectra show markers for shaft speed and BPFO, BPFI, BSF (with 2× and 3× harmonics) and FTF, placed using each reading’s actual measured speed.
The point’s trends gain BPFO env, BPFI env, BSF env, and FTF env — the envelope energy in each defect band, reading by reading.
You can set bearing band alarms on them (next section).
Setting alarm limits#
Alarms are what make Needs attention mean something. They’re defined by alarm rules, on three levels:
An installation default for each measurement type — for example, “for any temperature point, warn at 55 and go critical at 75”.
For vibration on rotating equipment, the ISO 10816 default that follows from the asset’s class.
A point override for the cases where one specific point should behave differently.
Open a point and click Alarm rules to see what’s in effect.
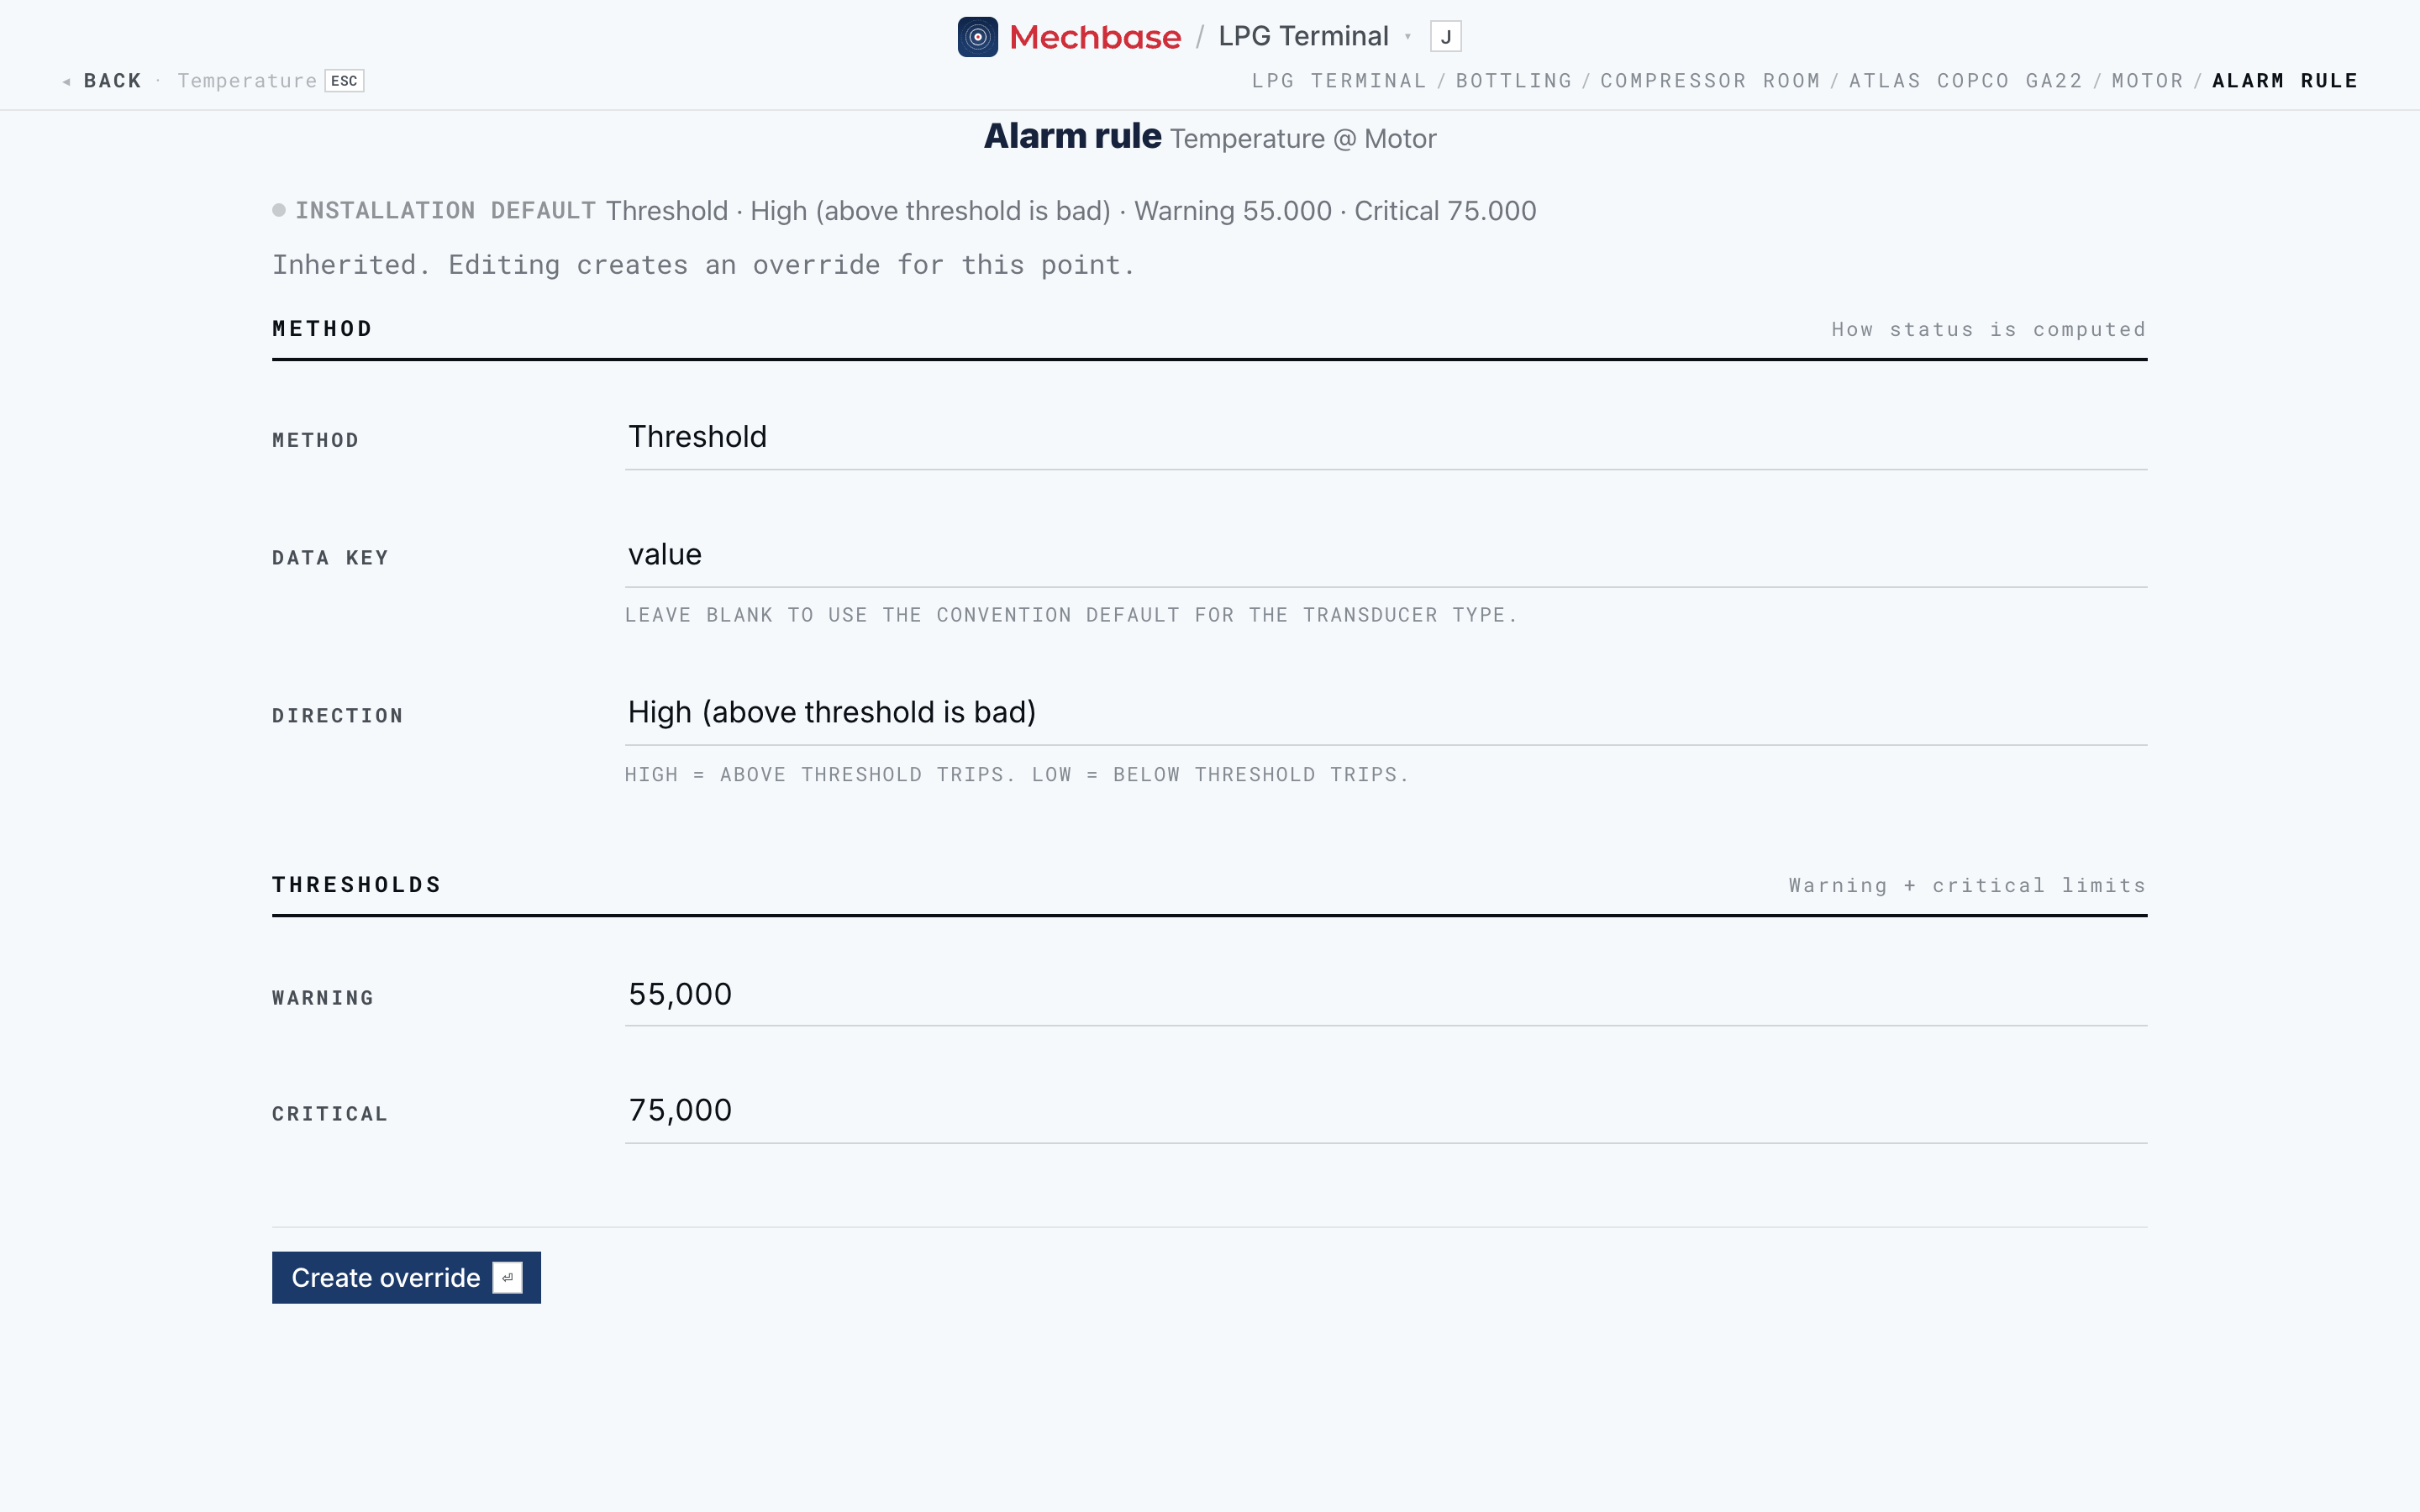
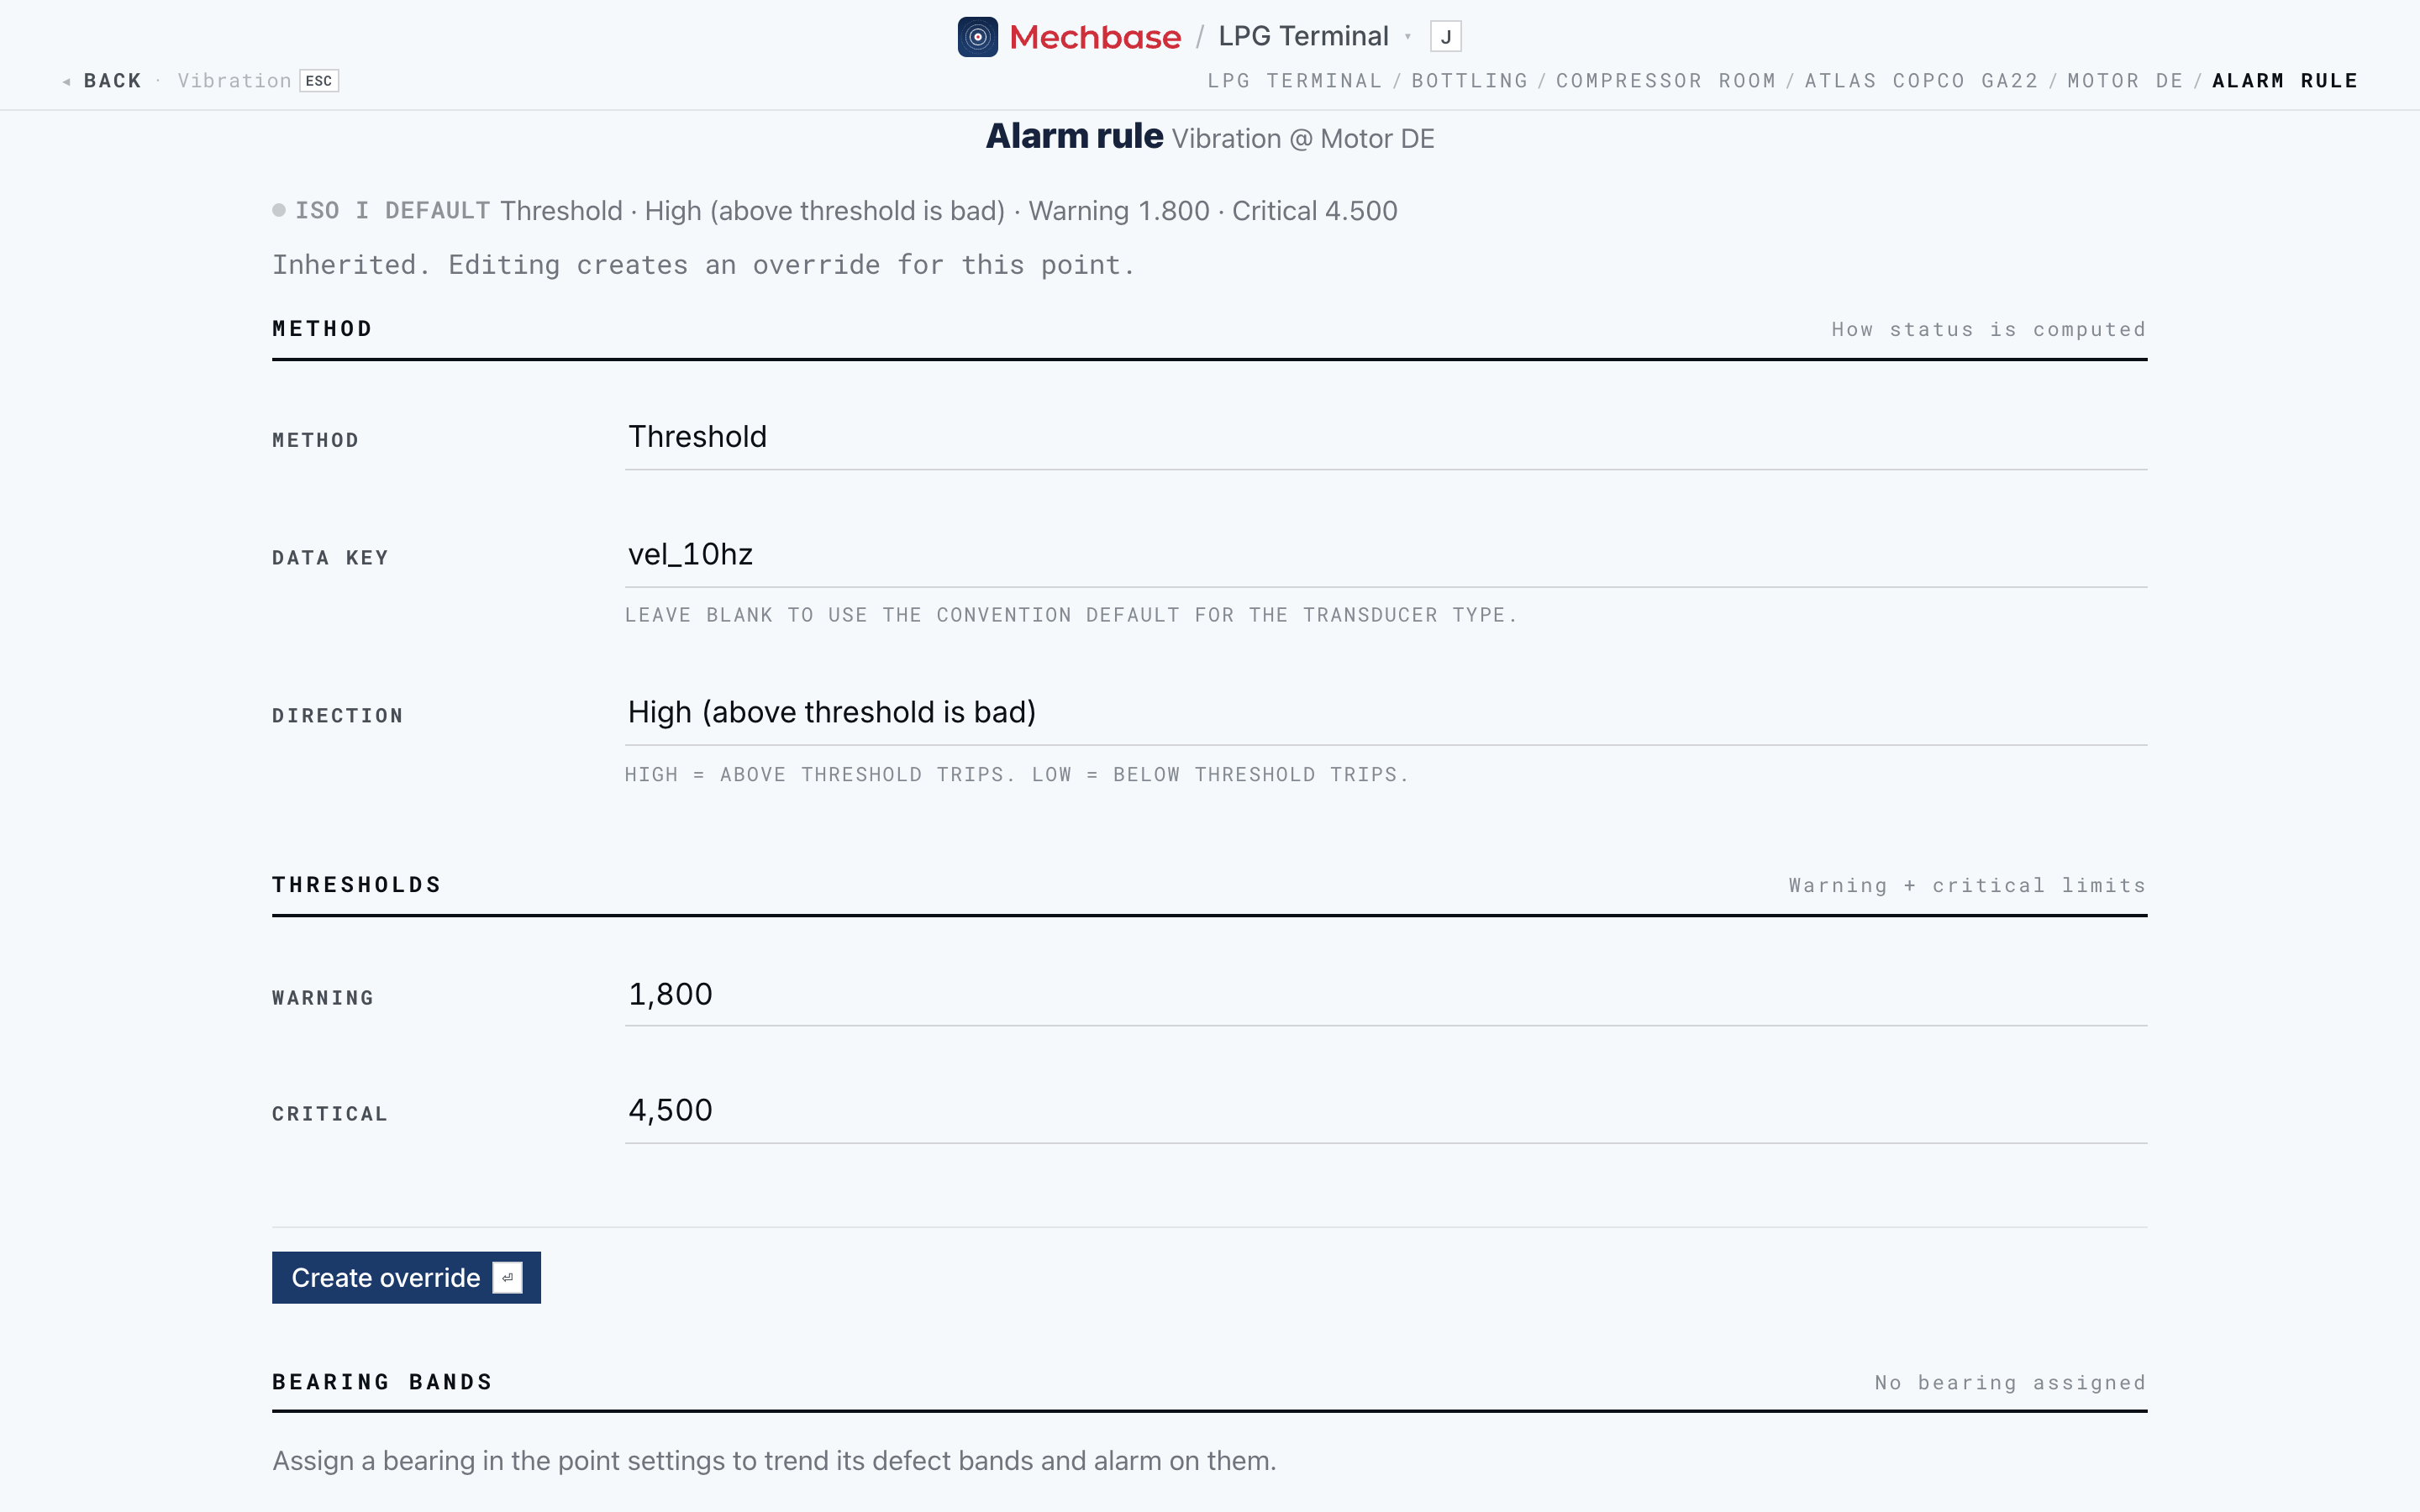
The line at the top tells you where the rule comes from — Point override, ISO … default, Installation default, or No rule configured — and what it says (“Threshold · High (above threshold is bad) · Warning 55 · Critical 75”). When the point is inheriting a rule, the form below is already filled in with it: “Inherited. Editing creates an override for this point.”
An alarm rule has two parts:
Method — how the status is worked out:
Threshold — a simple limit on the value. The common case.
Narrowband Envelope — watches a specific frequency band, for spotting a particular vibration fault.
Maintenance due — raises a status based on time or usage, for condition-plus-schedule maintenance.
Plus the Data key (which value of the reading to watch — blank uses the usual one for the type) and the Direction: High (above the threshold is bad — temperature, vibration) or Low (below the threshold is bad — a flow or pressure that shouldn’t drop).
Thresholds — the Warning and Critical limits.
Adjust them and click Create override (or Create rule where no default applies, or Save rule when you’re editing an existing override). The new limits appear immediately on the point’s trend.
To go back to the inherited rule, use Remove override at the bottom. It takes effect at once, with an Undo in case you didn’t mean it.
Bearing bands. On a vibration point with a bearing assigned, the page adds a Bearing bands section. It shows the current verdict for the defect bands and any band rules in force. Each Band rule picks a Band (or every envelope band), a Mode — an Absolute value, or a Multiple of baseline (3× for warning and 6× for critical if you leave them blank) — and the Warning and Critical limits; click Save band rule. Relative rules compare against a baseline Mechbase learns from the first five waveform readings while running; Reset baseline starts a fresh one — do it after a bearing change, a repair, or a remount.
Tip: Base your limits on history and expert judgement, not a guess. The normal band under each chart, and the limit · prev · normal line on a reading’s page, show you where the value really sits. Set warning and critical limits that sit clearly above (or below) that band.
Note: Installation-wide defaults are maintained centrally by your Mechbase administrator (Setting up and managing your account). Point overrides are yours to set.
Keeping false alarms down#
A predictive-maintenance system is only worth as much as people trust it. If it cries wolf — firing an alarm every time a sensor twitches or a reading blips — teams stop paying attention, and the genuine faults get lost in the noise.
Mechbase is deliberately built to avoid that. Instead of tripping on a single reading that crosses a limit, it looks at the recent pattern:
Every reading gets a status against the alarm limits — normal, minor (a little past the limit), or major (well past it).
Mechbase averages the status over the last several readings, not just the latest one.
The state changes only when that average crosses a threshold — so a sustained run of off readings moves the asset to Warning or Critical, while a lone spike does not.
On top of that, Mechbase knows when a machine is stopped and keeps those readings apart from the running trend, and relative rules compare each machine against its own learned baseline rather than a one-size-fits-all number.
That’s why the states are Check / Warning / Critical rather than a blunt on/off: Check is Mechbase telling you “a soft pattern is forming here” before it ever escalates. The payoff is fewer false alarms, warnings you can act on with confidence, and maintenance effort spent on real problems instead of chasing ghosts.
Note: Two things shape how responsive this is — the alarm limits (from history and expertise) and how many recent readings are averaged. A longer window is steadier but slower to react; a shorter one reacts faster but tolerates less noise. Treat the first weeks on a new point as a “learning” period and review both.
How a reading becomes a state#
Pulling the whole chapter together, here’s the journey of a single reading — whether it arrived automatically from a MaintNode device or was typed in on a route:
It’s recorded against its measurement point and added to the trend.
It’s scored against the point’s alarm rule — normal, minor, or major.
It’s combined with recent readings (the false-alarm logic above) to decide the point’s state.
The asset’s state rolls up from its points and its open non-conformities — the worst of them sets the asset’s state, and feeds the in alarm count.
Everything downstream updates: the asset’s colour, Needs attention, the section cards, any dashboards, a plain-language line in the activity feed (“degraded to warning”), and an email to everyone who asked for one at that level.
Running-state readings (Production) and on/off State readings take a different path: they open and close periods rather than being scored and averaged.
So the numbers you act on across Mechbase aren’t opinions or stale spreadsheet entries — they’re the live result of this pipeline, running on every reading.