13 · Triaging Needs attention#
Working the Needs attention list each morning.
Open Mechbase, work the Needs attention list from the top, and you’ll have dealt with the day’s real problems in the order they matter — this chapter is the recipe for doing it fast and in the right sequence.
The one-minute version#
Open Needs attention (press 3), work from the top (Critical, then Warning, then Check), click each asset to see why it’s flagged and how it’s trended, then act. Sensor-driven items clear themselves once readings settle; a failed inspection check you close by hand with Resolve. Finish with the Silent rows at the bottom. That’s the whole loop. The rest of this chapter is the detail.
For the reference on the screen itself, see Staying on top of what needs attention.
Set up your alerts once#
Triage starts before you open the app. On My Profile → Email notifications, choose your Alert level — Check and above, Warning and above, or Critical only — and whether you want Status changes and Route reports. Click Save notifications, then Send test email to make sure it arrives. From then on, a new problem at your level reaches your inbox without anyone watching the screen (Getting started).
Open Needs attention#
The home page’s Needs attention panel shows the top six items, with a count of how many are active and how many are silent. The full list lives on its own page — open it from the +N more link on that panel, from Needs attention in the menu, or press 3.
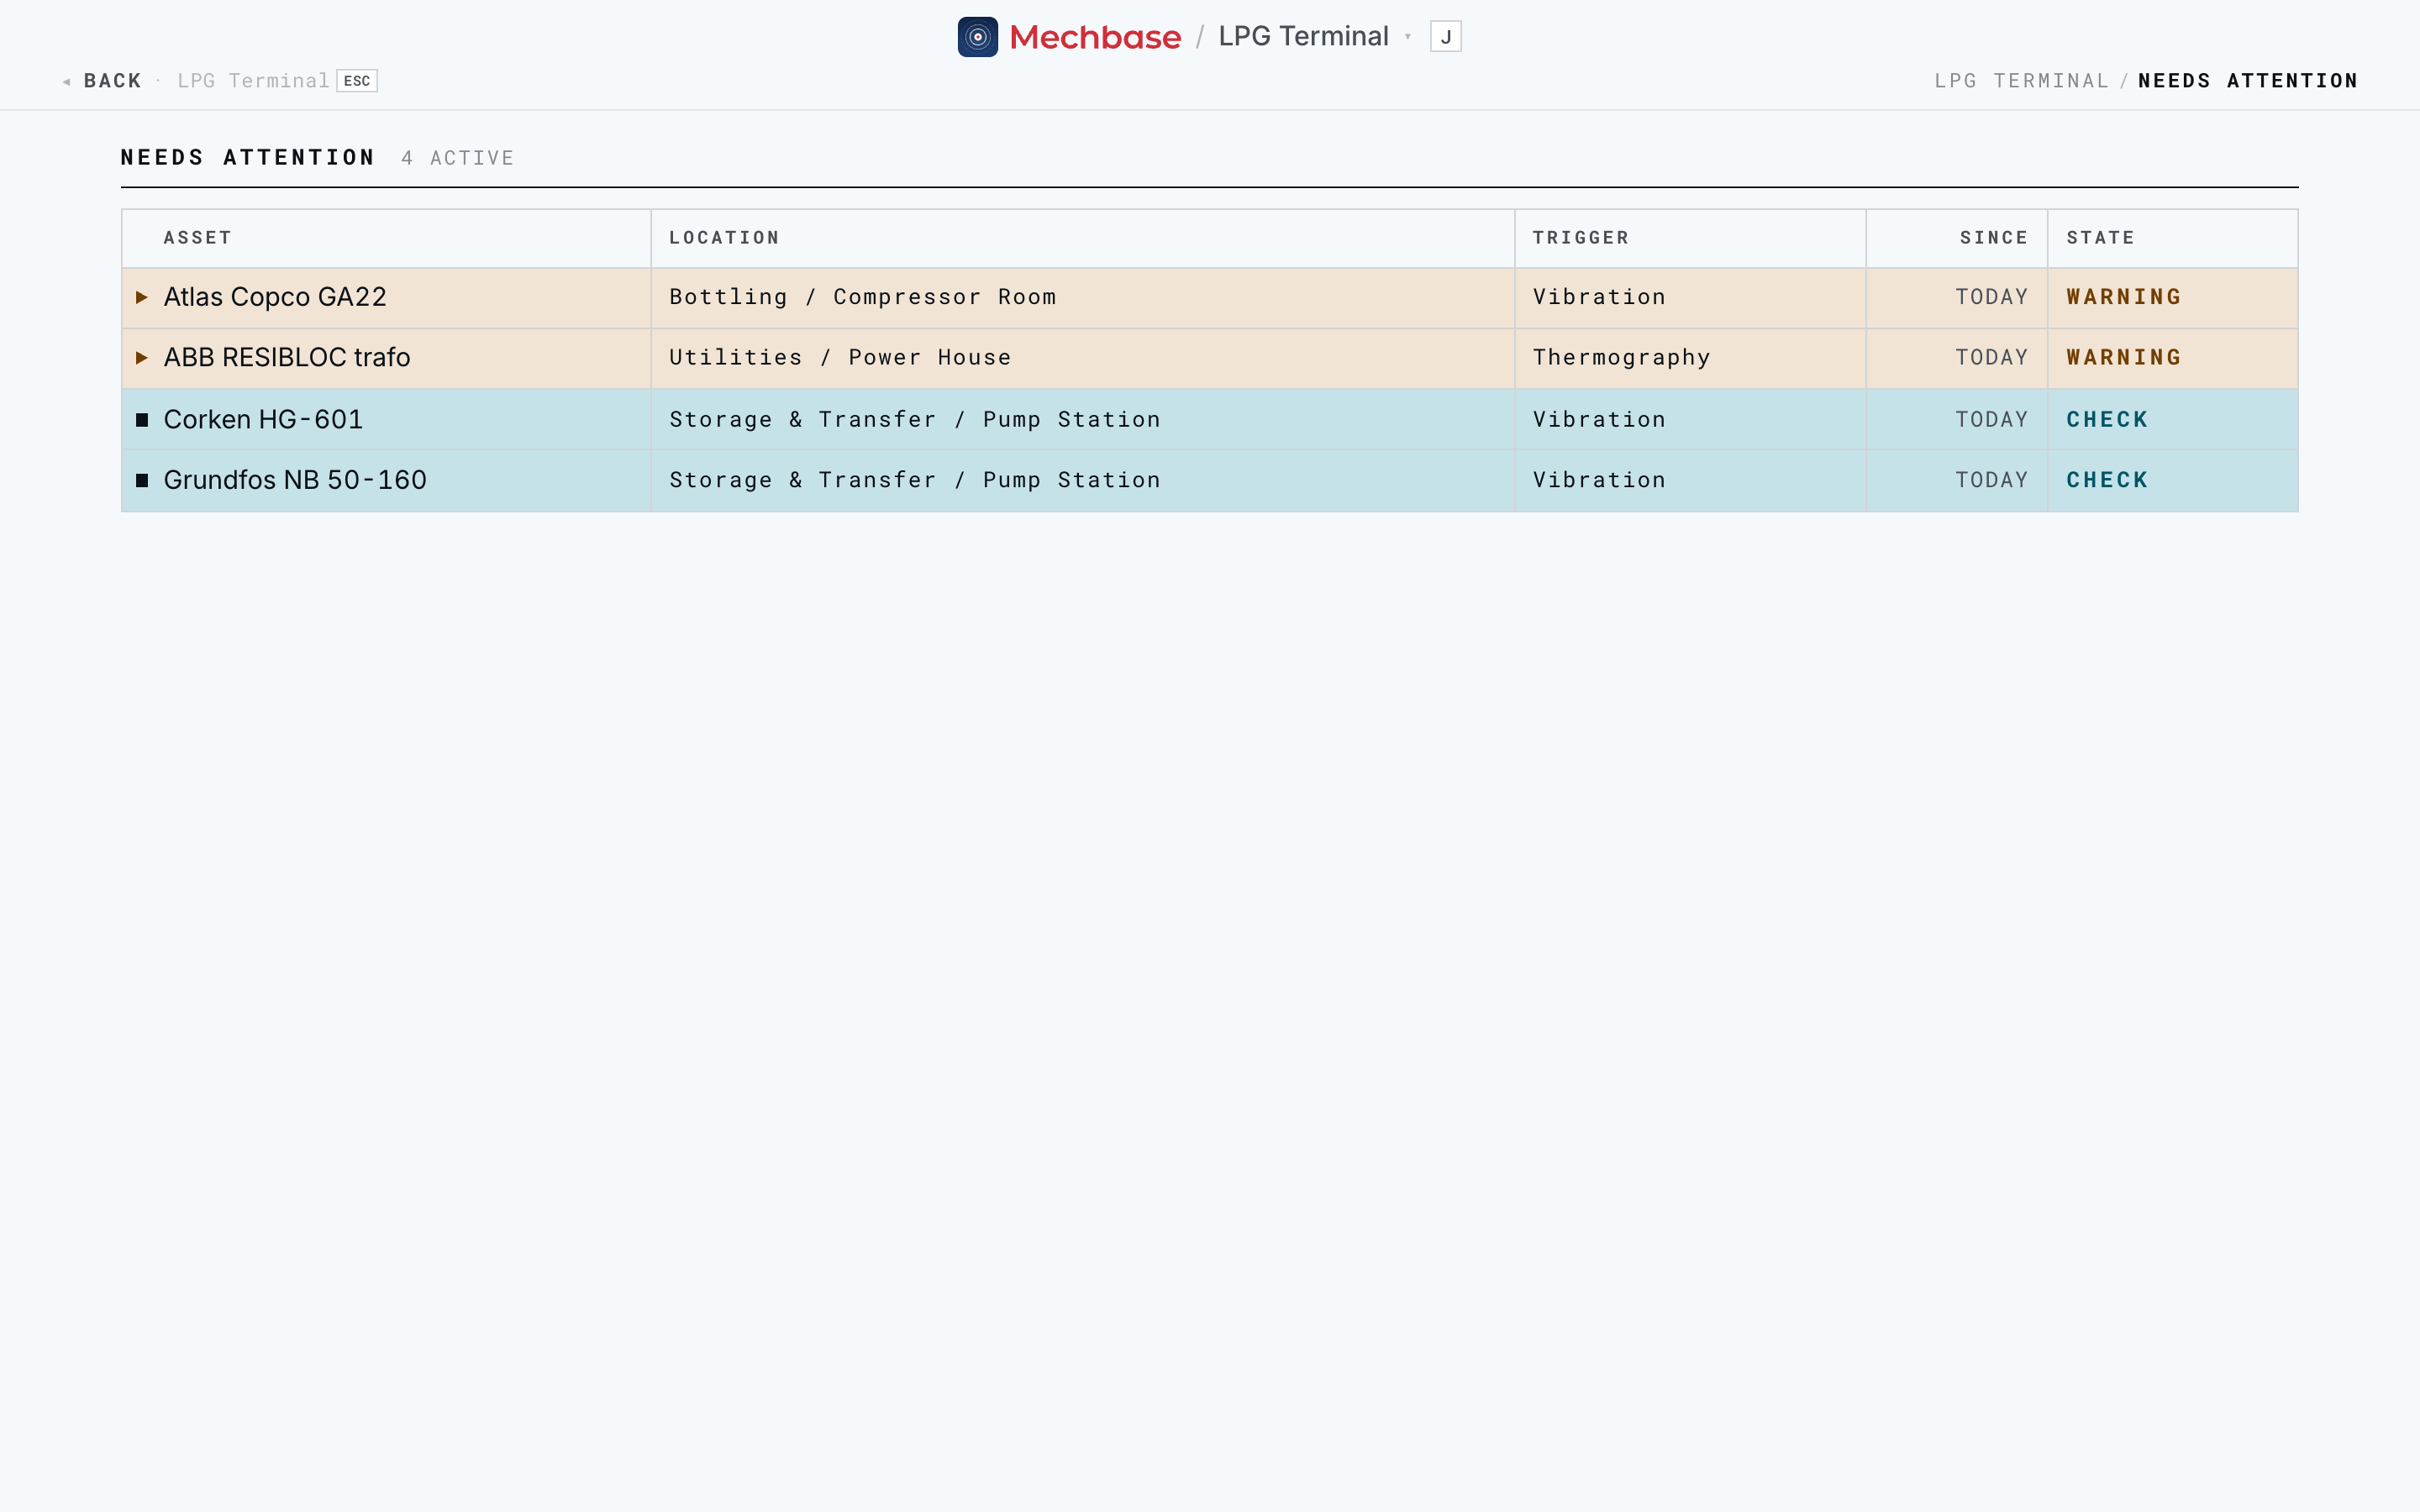
It’s every asset at the site that isn’t currently Nominal, most urgent first. If it’s empty, it says “All assets are nominal” and you’re done.
Tip: Responsible for just one area? Open your section from its card on the home page — its table shows every asset in the area with its state, zone by zone. Or use Points (
5) with the section filter to see every reading in your area at once.
Work it top-down, most urgent first#
The list is already sorted by priority, so working from the top is working by urgency. Take it in this order:
Critical first — red, severe, act now.
Then Warning — amber, clearly degraded, plan an intervention.
Then Check — teal, an early soft signal.
Every row carries the state word as well as the colour. Read the Trigger column as you go to know what raised each one — the measurement point that’s out of limits (Motor DE), or the inspection check that failed (Oil level and quality). The Since column tells you how long it’s been in that state.
Tip: Don’t skip the Check items. A Check is Mechbase telling you a soft pattern is forming — the cheapest time to look is before it becomes a Warning.
Open an item to see why it’s flagged#
Click the row to open the asset. There you get the full picture:
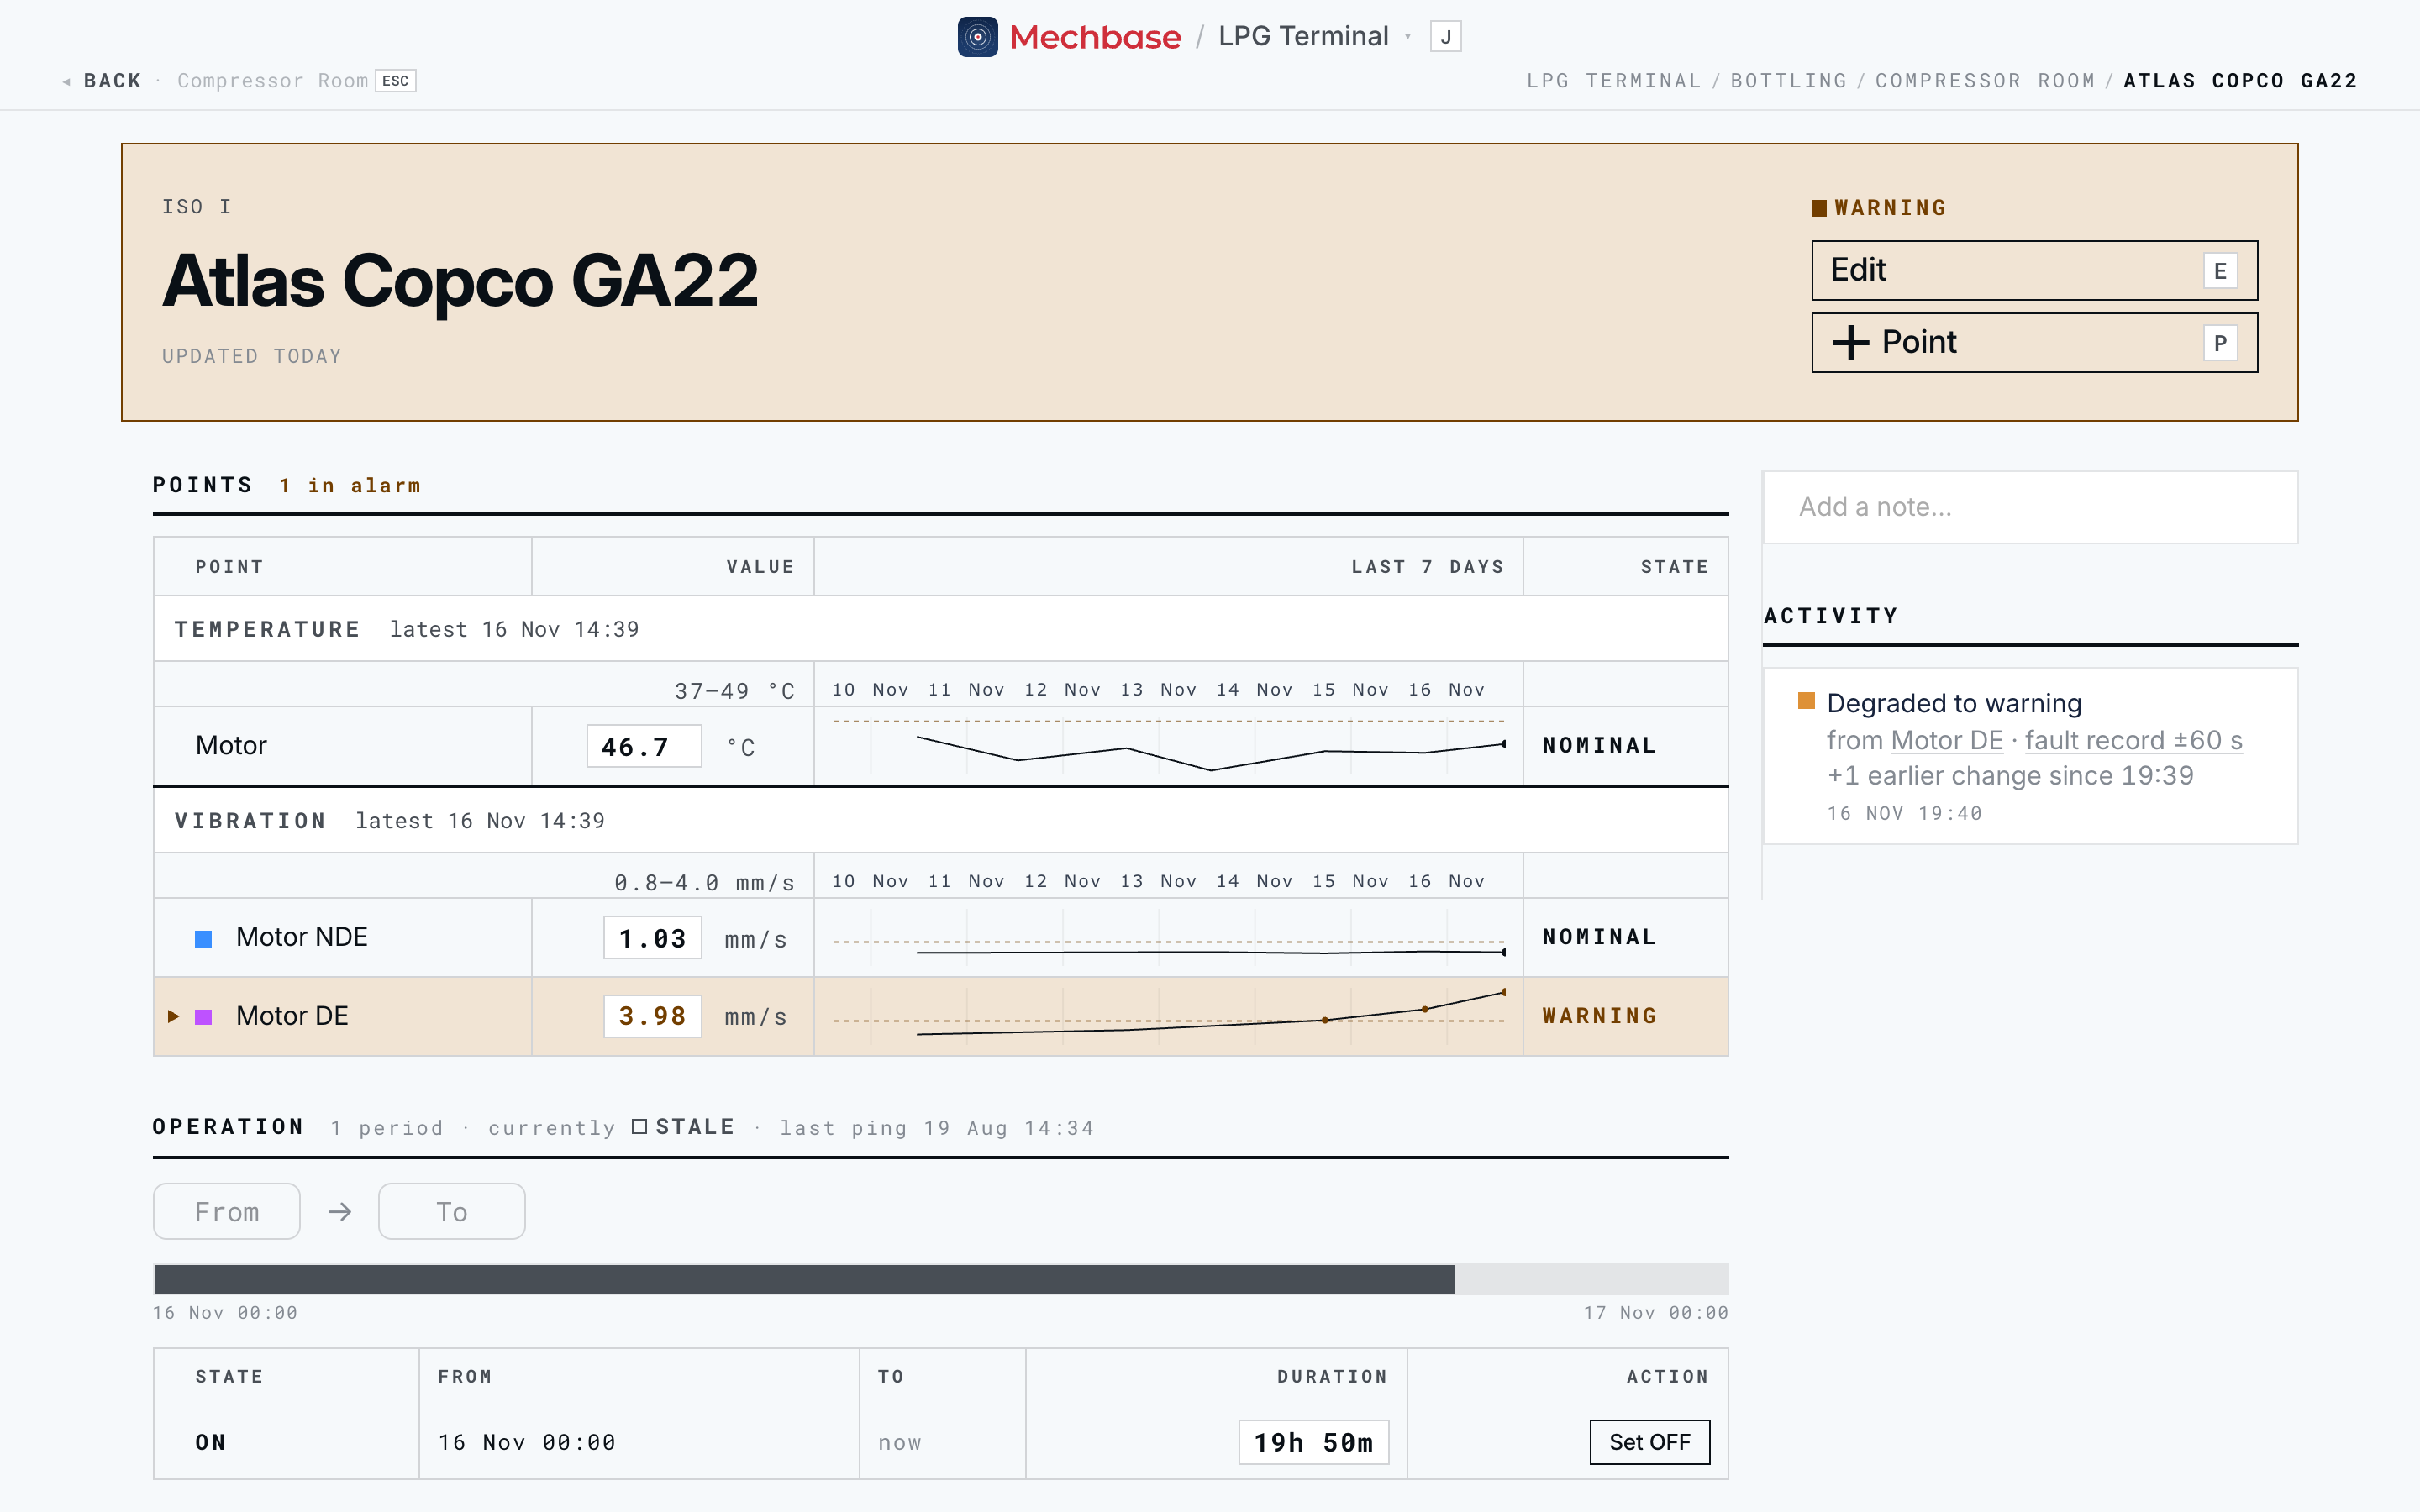
The Points section says how many are in alarm, with a week of trend on every sensor. Scrub across the trends to see what every sensor was doing at the moment the trouble started.
Activity gives the dated, plain-language trajectory (“degraded to warning”, “improved to check”), with a fault record ±60 s link on changes caused by a reading — a one-page snapshot of every sensor on the machine in the minute before and after.
Open non-conformities from inspections are pinned at the top of Activity.
That history is what tells you whether this is a one-off spike or a trend that’s been building for weeks. For a vibration point, click it and open the Inspect panel to look at the waveform and spectrum (Measurements, trends, and alarms).
Act, then clear or resolve#
Needs attention reflects reality — it’s not a to-do list you tick off. You clear an item by fixing the underlying condition, and it comes off the list on its own. Which of two things happens depends on what raised it:
Sensor-driven items (vibration, temperature, and the like) clear automatically once readings return to normal. Because Mechbase waits for the pattern to recover rather than the first good reading, a cleared item genuinely means the asset has settled — so act on the real-world cause and let the next readings close it.
Inspection-driven issues — a failed check, a non-conformity — you close by hand. Open the affected asset, find the item pinned at the top of Activity, deal with the real-world problem, and click Resolve. Add a Resolution comment saying what you did, and click Mark resolved.
Either way, leave a note on the asset as you go (“Bearing greased, recheck Thursday”) — or, if you’re the analyst, Record finding on the reading with the fault, severity, and recommended action, so it can flow to your maintenance system. When the condition is resolved the asset drops off Needs attention, the counts tick down, and the change is written to the activity feed — so there’s a dated record of both the problem and its fix.
Heads-up: You never set a state by hand to make an item disappear. If a sensor item is still on the list, the readings haven’t settled yet — chase the cause, not the flag.
Don’t forget the silent ones#
After the health alerts, the list shows Silent assets — ones whose sensors used to report but have stopped. Their trigger reads “No reading: …”. A silent asset might be perfectly healthy, or failing where no one can see it. Check the sensor and its MaintNode (Is my device healthy?), or the route that should have measured it.
Where the same items show up#
You won’t only meet these items on the list — Mechbase surfaces the same backlog wherever you’re already working, so triage stays honest across the whole app:
The Needs attention panel on the home page and the count badge on the menu.
The warning and critical counts on each section card.
The state and in alarm count on each asset page.
Dashboards, where an alarmed point’s row is tinted.
The activity feed, as each state change happens.
Your inbox, at the alert level you chose.