Capturing field readings#
Taking a reading at the machine — by hand, by thermal camera, and by vibration sensor.
You’re standing at a pump with your phone. This chapter is the recipe for turning that moment into a reading Mechbase can act on — a number, a thermal image, or a vibration signature that lands on the point’s trend and can move the asset’s state. It’s the same workflow whether you reached the point from a route or opened it on its own, and it works with no signal at all.
If you only read one thing, read Where the reading lands — that’s what a reading is for.
Before you start#
Three things need to be in place — all covered in Mechbase on your phone:
The app, signed in. You’re on the home hub, on the right installation (the site you’re visiting).
Sensors at hand, if you’re capturing thermal or vibration. The FLIR ONE Edge camera connects when you open a thermal capture; the Bluetooth accelerometer connects automatically — wake it with a tap of the magnet (Your vibration sensor).
Nothing else. No signal required — see Work offline, sync later.
Tip: Connecting a sensor takes a moment. The banner at the top of the route or point shows its state — Connecting…, connected, or Sensor lost — with Connect / Reconnect and an ⓘ for the steps to wake and link it. On iPhone the thermal camera starts linking as soon as you open a route that needs it; tap Connect for the vibration sensor when you reach your first vibration check.
Open the point in front of you#
You reach a measurement point one of three ways:
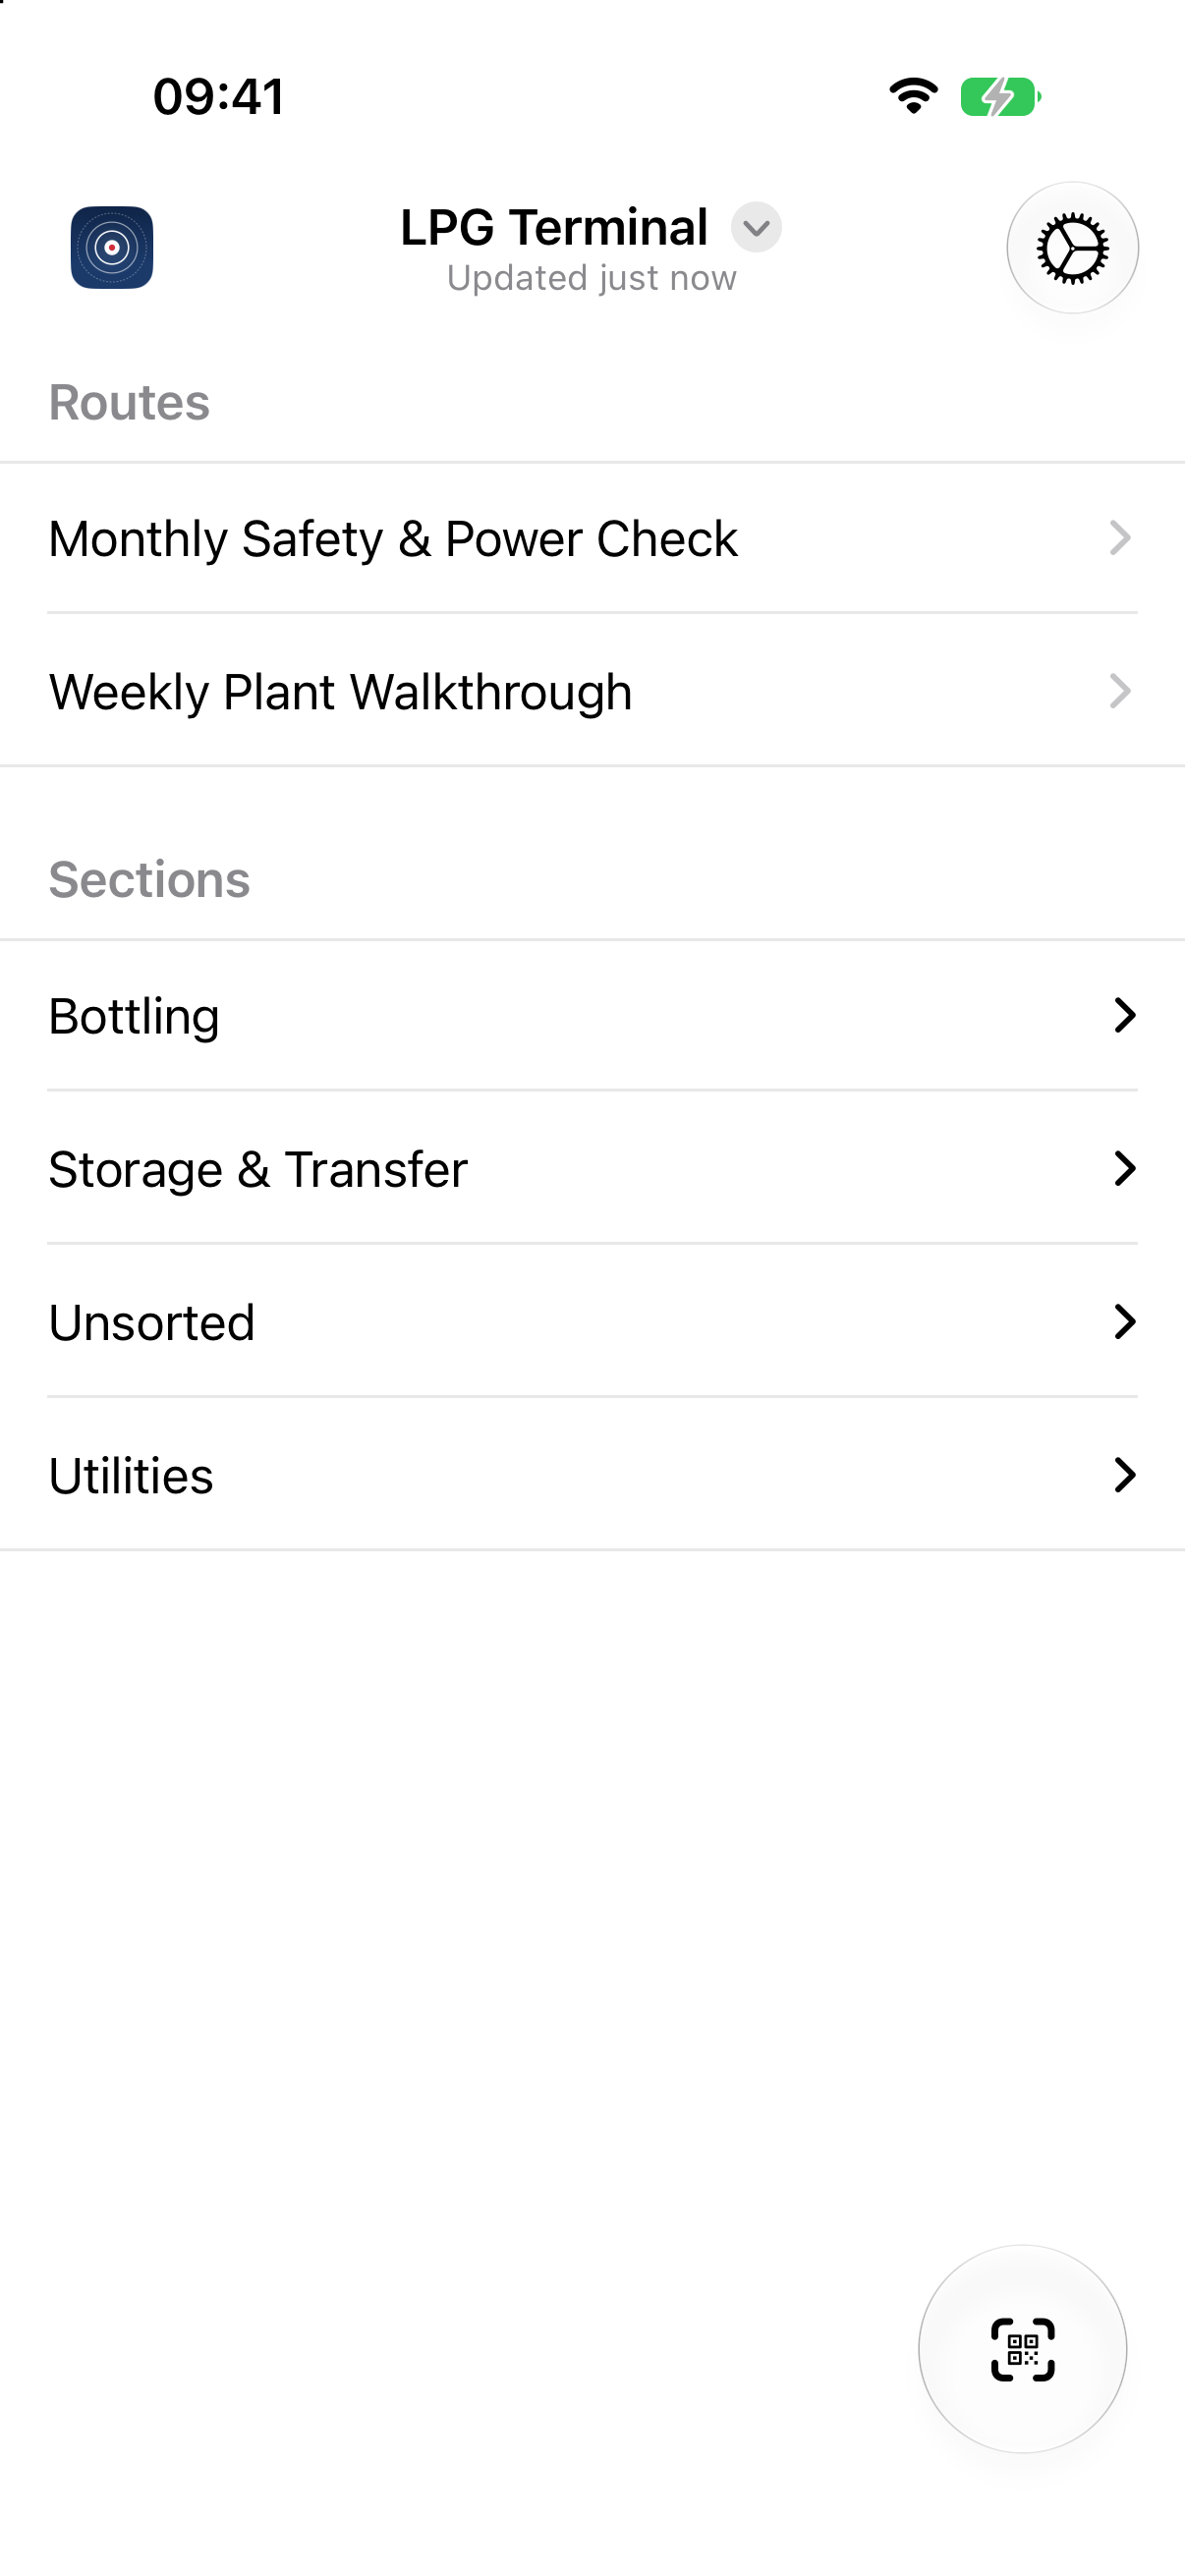
Browse the plant on the home hub — Sections → Zones → Assets, then tap the point under the asset’s Measurement Points.
Scan its QR code — tap the scanner and point at the code on the equipment; the app jumps straight to that point (or, if you’re in a route that includes it, to its check).
Work a route — open the route and tap a Numerical or Measurement check; it opens on the right point for you (Walking a route).
The point opens with the input that matches its type — a number field for most points; for thermal and vibration points, a sensor banner and a Capture button that stays disabled until the sensor is connected. The next three sections cover each in turn.
Take a reading by hand#
The everyday case — a temperature off a gauge, a pressure, a level.
Type the value in the large field and save (✓). Under the field, last: shows the previous reading, so you can sanity-check before you commit — if you’re about to enter 4.2 where the last reading was 42, that gap is right there to catch. On a route check with limits, a bar shows where your value falls — OK, Watch, or Alarm. Opened on its own, the point also lists its Recent readings below.
The value goes in the point’s own unit, shown beside the field (ultrasound is always in dB). On the web, everyone then reads it in their own units (Reading a trend).
Screenshot needed (iOS & Android): a numerical route check with limits, showing the OK / Watch / Alarm bar and the last: value.
Capture a thermal image#
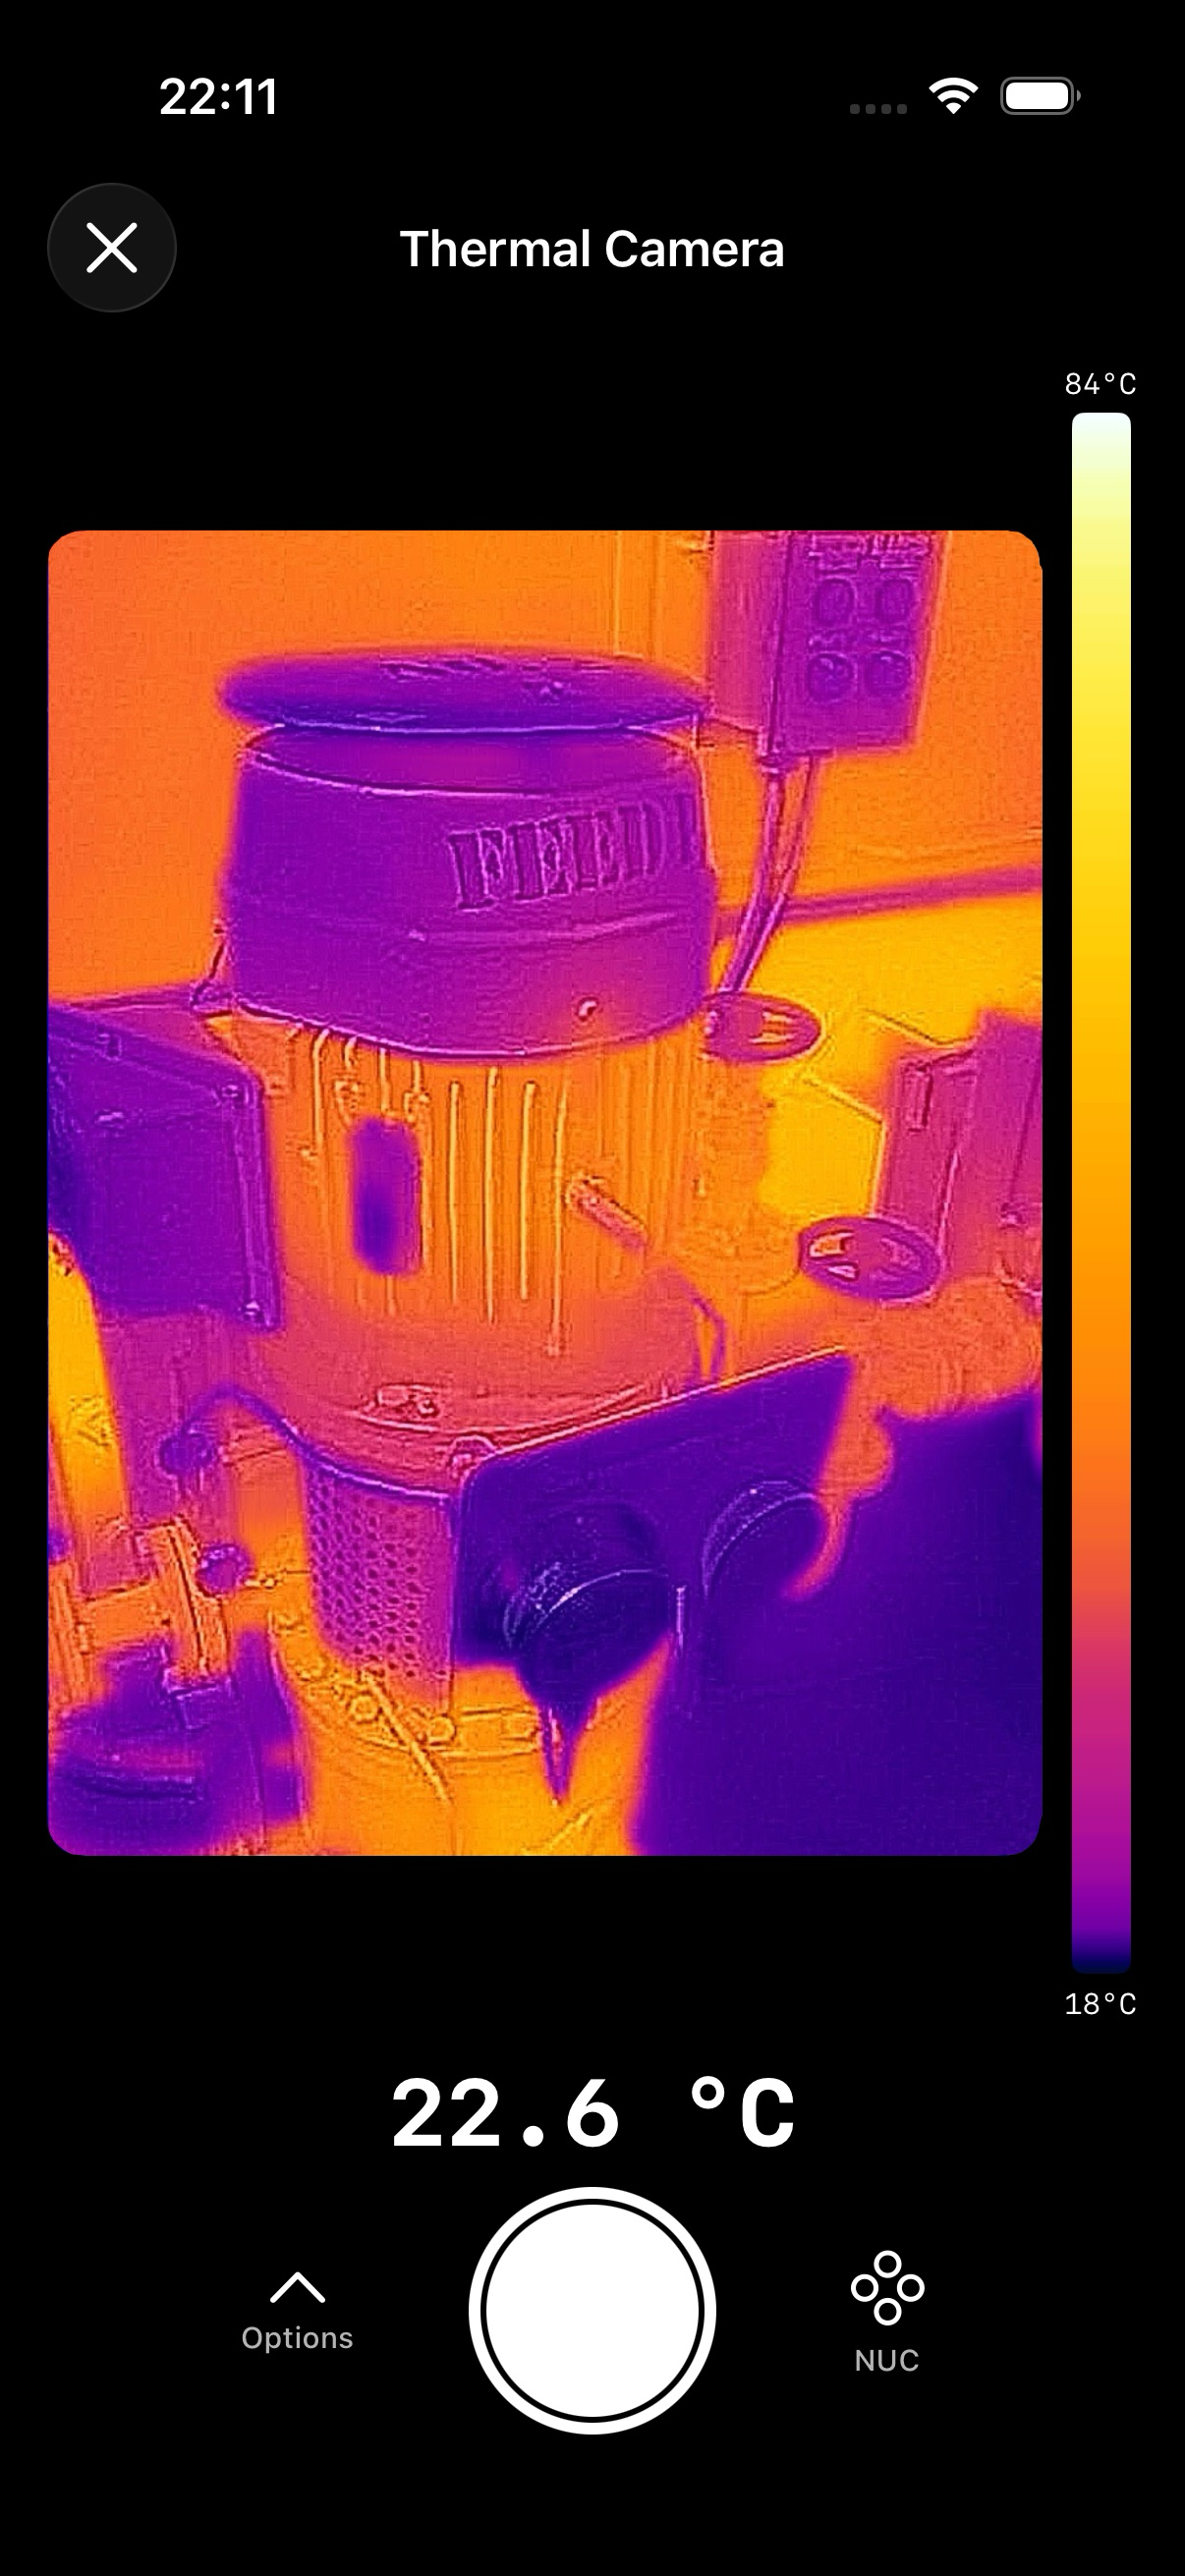
For a thermography point, the app connects to the FLIR ONE Edge camera and shows a live thermal preview — with a temperature scale down the side.
Frame the equipment in the preview. Under Options, pick the Color palette that shows the detail you want, and set the Emissivity to suit the surface (Matte, Semi-matte, Semi-glossy, Glossy). NUC recalibrates the sensor — the click you hear now and then is normal.
Capture a frame. The app automatically finds hotspots, marking the hottest regions for you.
Tap to add a hotspot, or tap a marker to edit it and grade it Minor or Major. Then Save — or Retake.
The thermal image and its hotspots attach to the reading, and a copy is saved to the phone’s photo library. A route check can hold several frames.
Capture a vibration reading#
For a vibration point, the app connects to the Bluetooth accelerometer. Pick the X, Y, or Z axis and capture: the sensor records about one second of waveform.
When the capture finishes you get the sensor’s RMS, Peak, Crest, and Vel 10Hz figures above the Waveform and FFT magnitude plots. Save attaches the full signature — the same waveform an analyst opens on the web — or Retake to try again.
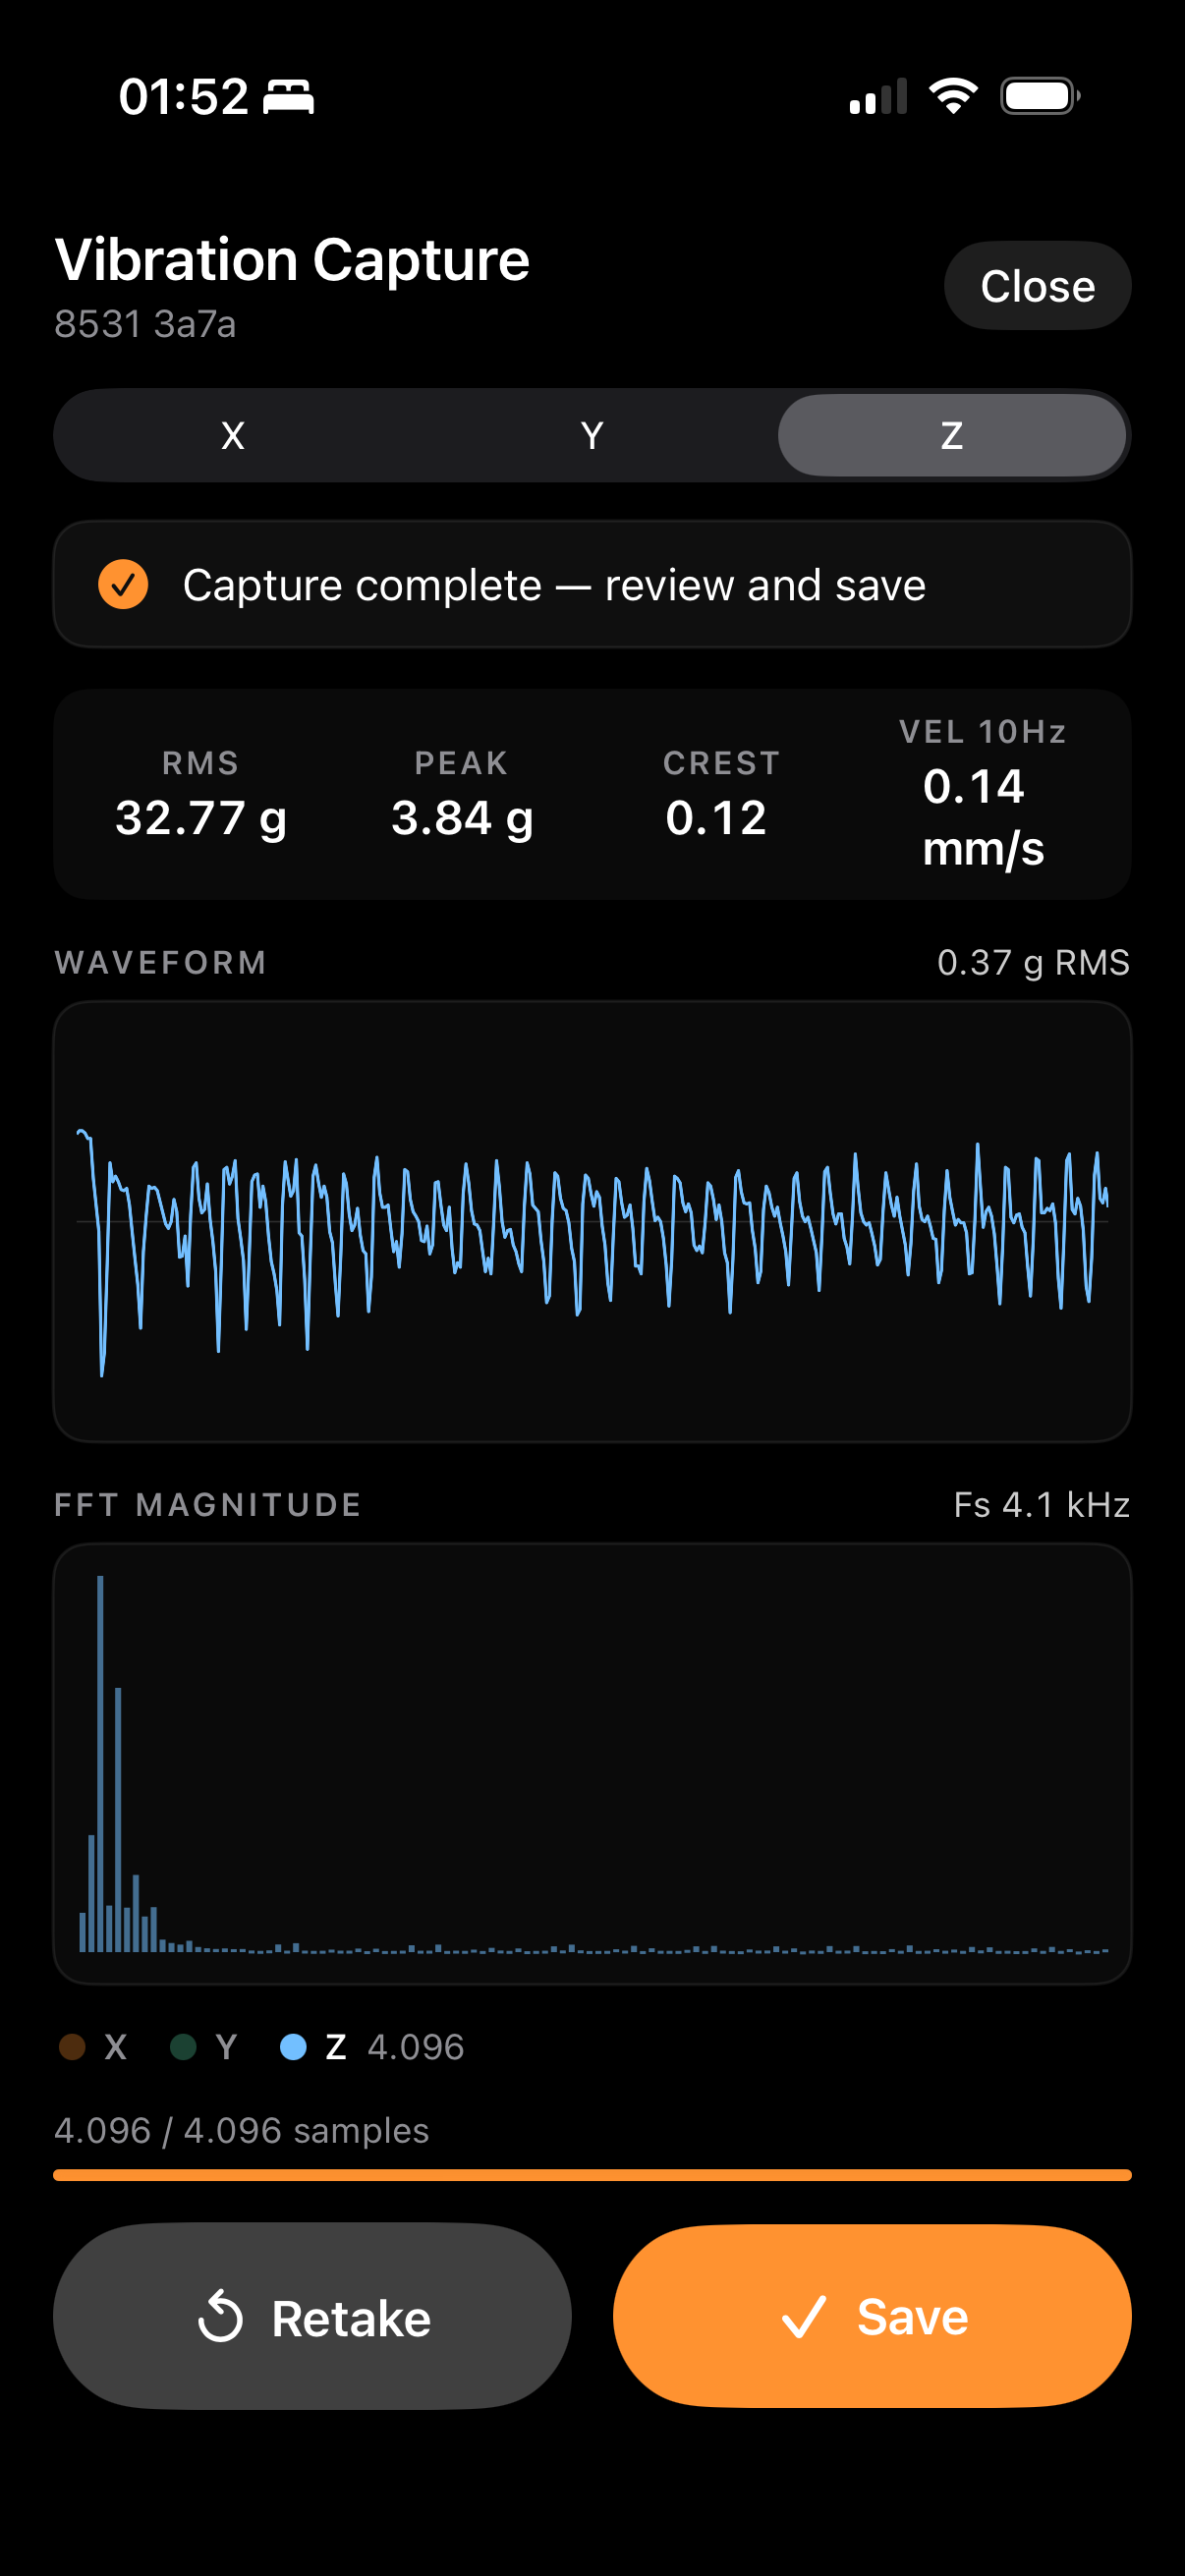
Because the whole waveform comes back with the reading, the point’s inspect view on the web — time waveform, spectrum, envelope, order lines, bearing markers — has everything it needs (Inspecting a vibration reading).
Heads-up: Mount the sensor on the same spot, the same way, every visit — on clean, bare metal in the bearing’s load zone, never on cooling fins or covers, with the X axis along the shaft. On a curved housing use a two-pole magnet and roll it on rather than letting it snap. A vibration reading only compares cleanly to history when it’s taken from the same mounting point in the same direction.
Add a photo and notes#
Every check — and every point opened on its own — has room for evidence, and it’s worth using:
Photo — Take Photo with the camera or Choose from Library. Snap the gauge face, the nameplate, the puddle under the coupling. One picture saves a paragraph of explanation later; camera photos are also saved to the phone.
Notes — free text in Add notes… for anything the number doesn’t say: “reading taken with guard off”, “new noise at start-up”.
Both ride along with the reading and show up against it on the web, so whoever triages it later sees what you saw.
Work offline, sync later#
Plant rooms and remote sites don’t always have a signal, and you don’t need one. The app keeps a local copy of your data and saves every reading on the device first:
Open points, take numerical, thermal, and vibration readings, attach photos and notes — all offline.
Everything syncs back to Mechbase automatically once you’re online again, in the background. The home hub’s sync status line tells you where things stand, and pulling down forces a sync.
Heads-up: Signing out deletes anything on the device that hasn’t uploaded yet — the app warns you first. On a shared field phone or tablet, make sure your readings have synced before you sign out.
Where the reading lands#
Saving isn’t the end of it. Every reading you take runs through the same pipeline as one that arrived automatically from a MaintNode device (How a reading becomes a state):
It’s recorded against the measurement point and added to the point’s trend.
It’s scored against the point’s alarm rule — normal, minor, or major.
It’s combined with recent readings, so a sustained pattern moves the state and a lone spike doesn’t.
The asset’s state rolls up from its points and open non-conformities — the worst of them sets the asset’s state, across Nominal / Check / Warning / Critical.
Everything downstream updates — the asset’s colour, the section counts, any dashboards, the Needs attention list, and alert emails.
So the reading you just took at the machine can be what moves an asset onto Needs attention for someone to triage — which is exactly where the next chapter picks up.