3 · Working with assets#
The asset page brings everything about a machine together in one place — its condition, every sensor on it with a week of trend, whether it’s running, its history, and any open issues. An asset is a single piece of equipment (a pump, a compressor, a genset, a panel), and this chapter walks through its page in detail, then shows how to read a single measurement point and how to build and adjust the structure underneath.
What’s on an asset page#
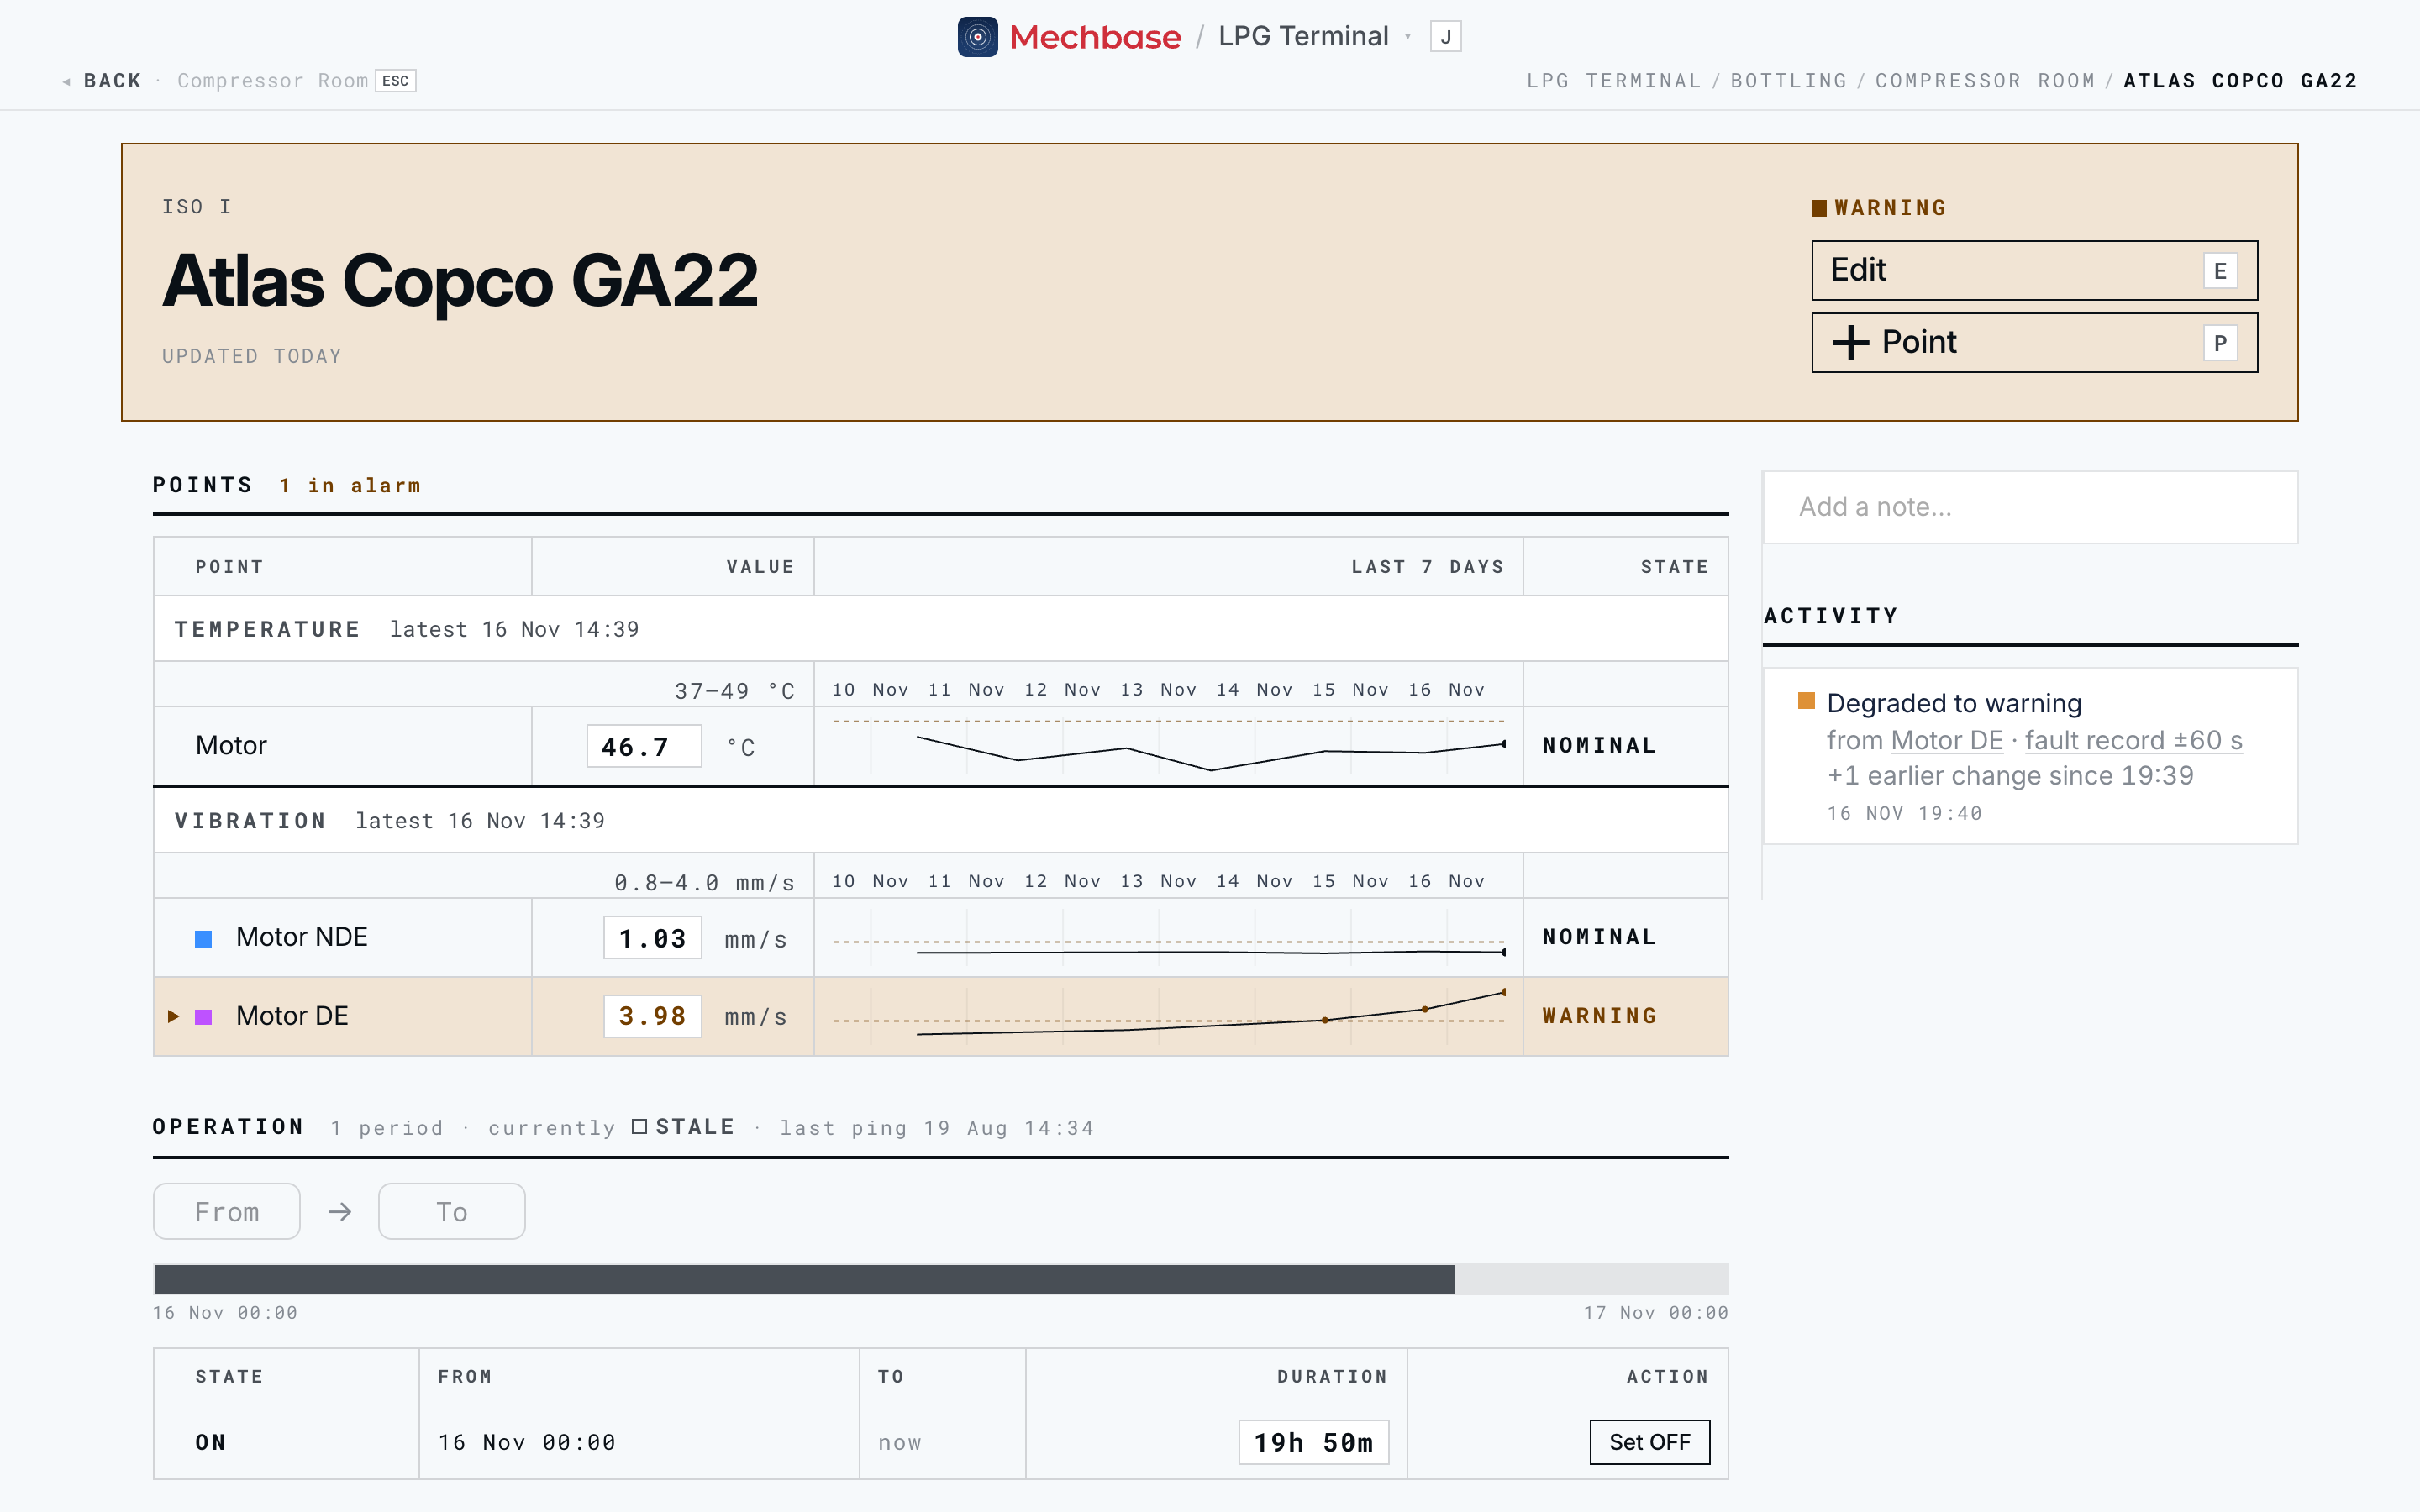
Open an asset by clicking its name anywhere it appears — a section or zone page, Needs attention, the Points page, search, or the activity feed. You land on a page like this.
The header#
The header gives you the asset at a glance:
Its ISO 10816 class (
ISO I) for rotating equipment — the vibration severity class for this machine — or its equipment type for anything else.Its name, and a nameplate line (maker, model, rating) if one has been entered.
Its current state (here, Warning) and when it was last updated.
Edit (
E) to change the asset, and Point (P) to add a measurement point.
Where the asset sits — section and zone — is in the breadcrumb at the top right.
Points#
The Points section lists every sensor on the asset, one row per point, grouped by type — here Temperature and Vibration. The heading counts how many are in alarm, and how many are not reporting.
Each row shows:
The point’s location (Motor DE, Motor NDE), with a colour swatch that matches its dot on the topology diagram.
Its latest Value, in your units.
Last 7 days — a small trend line. Every row in a group shares one scale and one time axis (printed above the group, with the group’s actual low–high), so you can compare sensors directly.
Its State.
Scrub the week. Move the pointer over any trend line: a cursor runs through every row in the group, the time appears above, and each row’s Value switches to that sensor’s reading at that moment. It’s the quickest way to see what every bearing on a machine was doing when one of them jumped.
Only alarm readings, the limits, and the latest point are coloured. Readings taken while the machine was stopped show as faint dots. A point whose live feed has gone quiet shows a No data chip and how long it’s been silent. Click any row to open the point.
Operation#
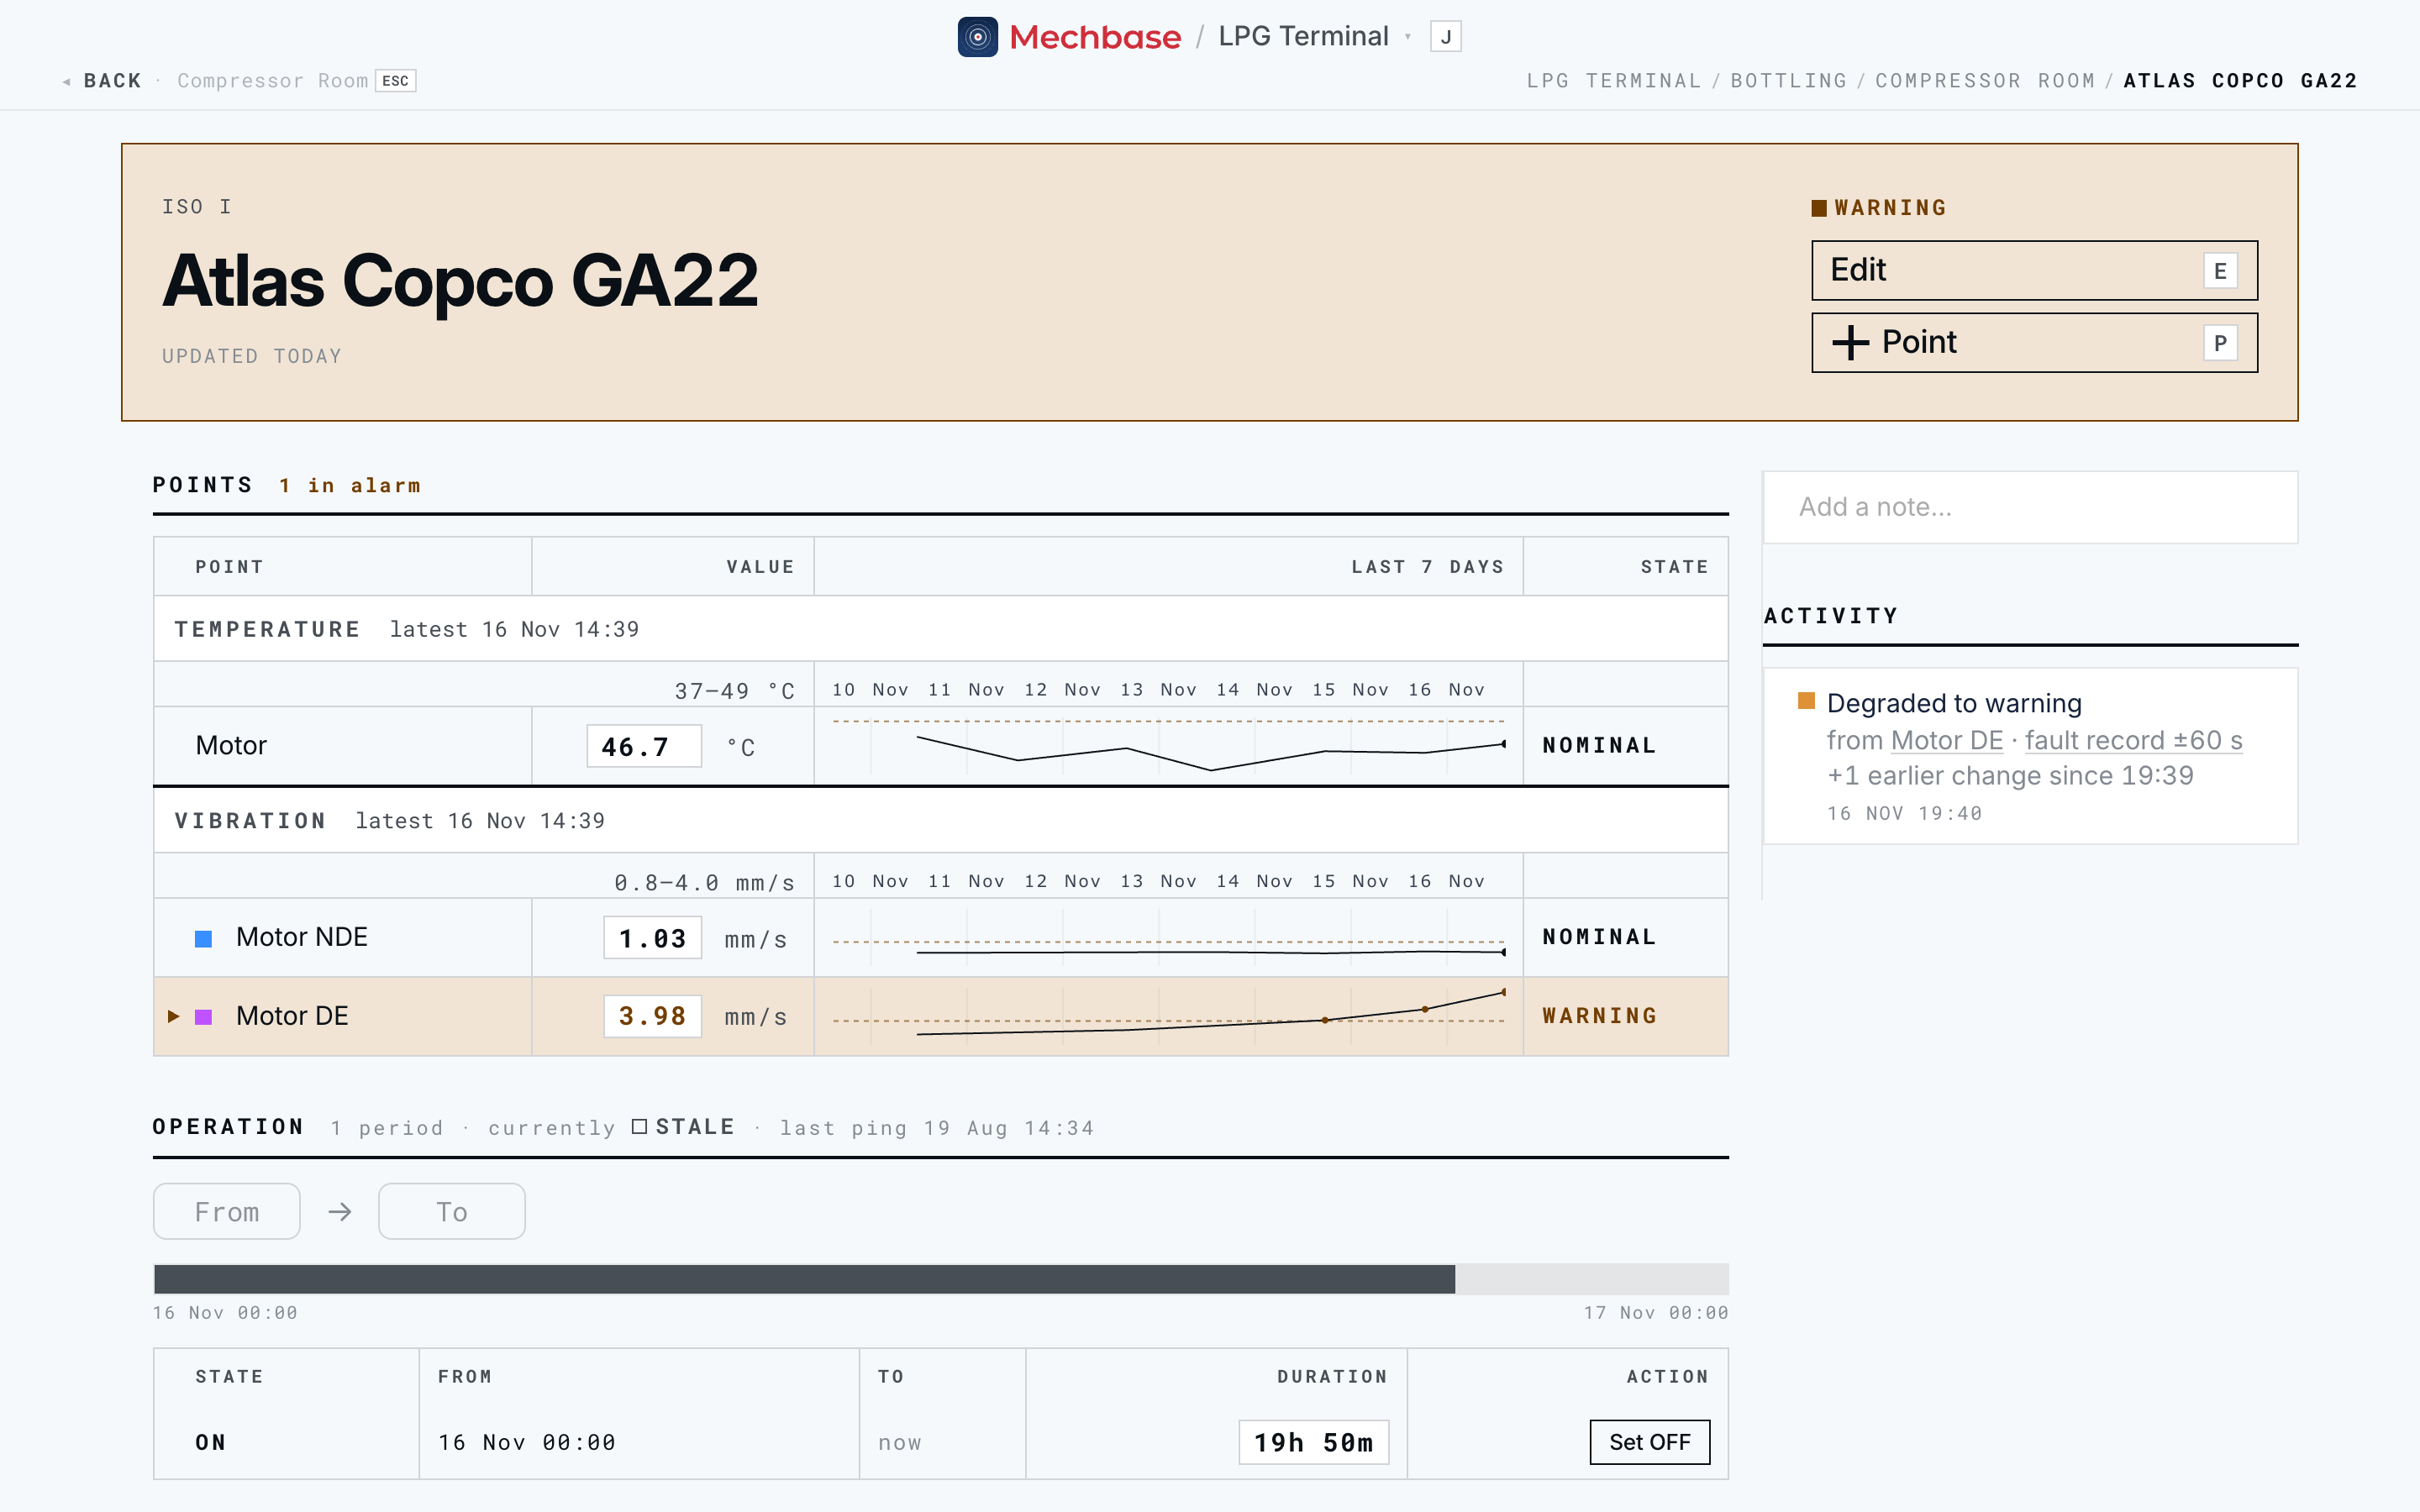
If the asset tracks whether it’s running, the Operation panel shows it. The heading reads the number of periods, whether it’s currently On, Off, or Stale, and when the running signal last pinged. Below it:
From → To — the window to show; today, midnight to midnight, by default.
A strip of the window, with running and stopped periods drawn differently.
A table of periods — State, From, To, Duration — newest first, with Set ON / Set OFF on the current period to correct it by hand.
Why it matters: some readings — vibration especially — only make sense while the machine is running. Mechbase knows when the asset was stopped and treats those readings accordingly (see Running state and operating hours).
Topology#
For rotating equipment, Topology is a simple map of the machine — its body segments (non-drive end and drive end of the motor and the driven machine) with a coloured dot for each measurement point. The same colours are used for the points and their trend lines, so you can connect a reading to a physical spot on the machine at a glance.
Attachments#
Attachments holds reference Photos and Docs for the asset — nameplate shots, drawings, manuals. Click Add photo or the document tile to upload; click any tile to open it full size.
Notes, activity, and open issues#
The right-hand side of the asset page is its conversation and history.
Notes. The Add a note… field at the top expands when you click it. Write
what you saw, optionally open Reference measurement points to tag specific
points, and click Post (or ⌘ Enter). You can edit or delete your own notes
later with the pencil and bin icons; deleting shows a short Undo so a slip is
never permanent.
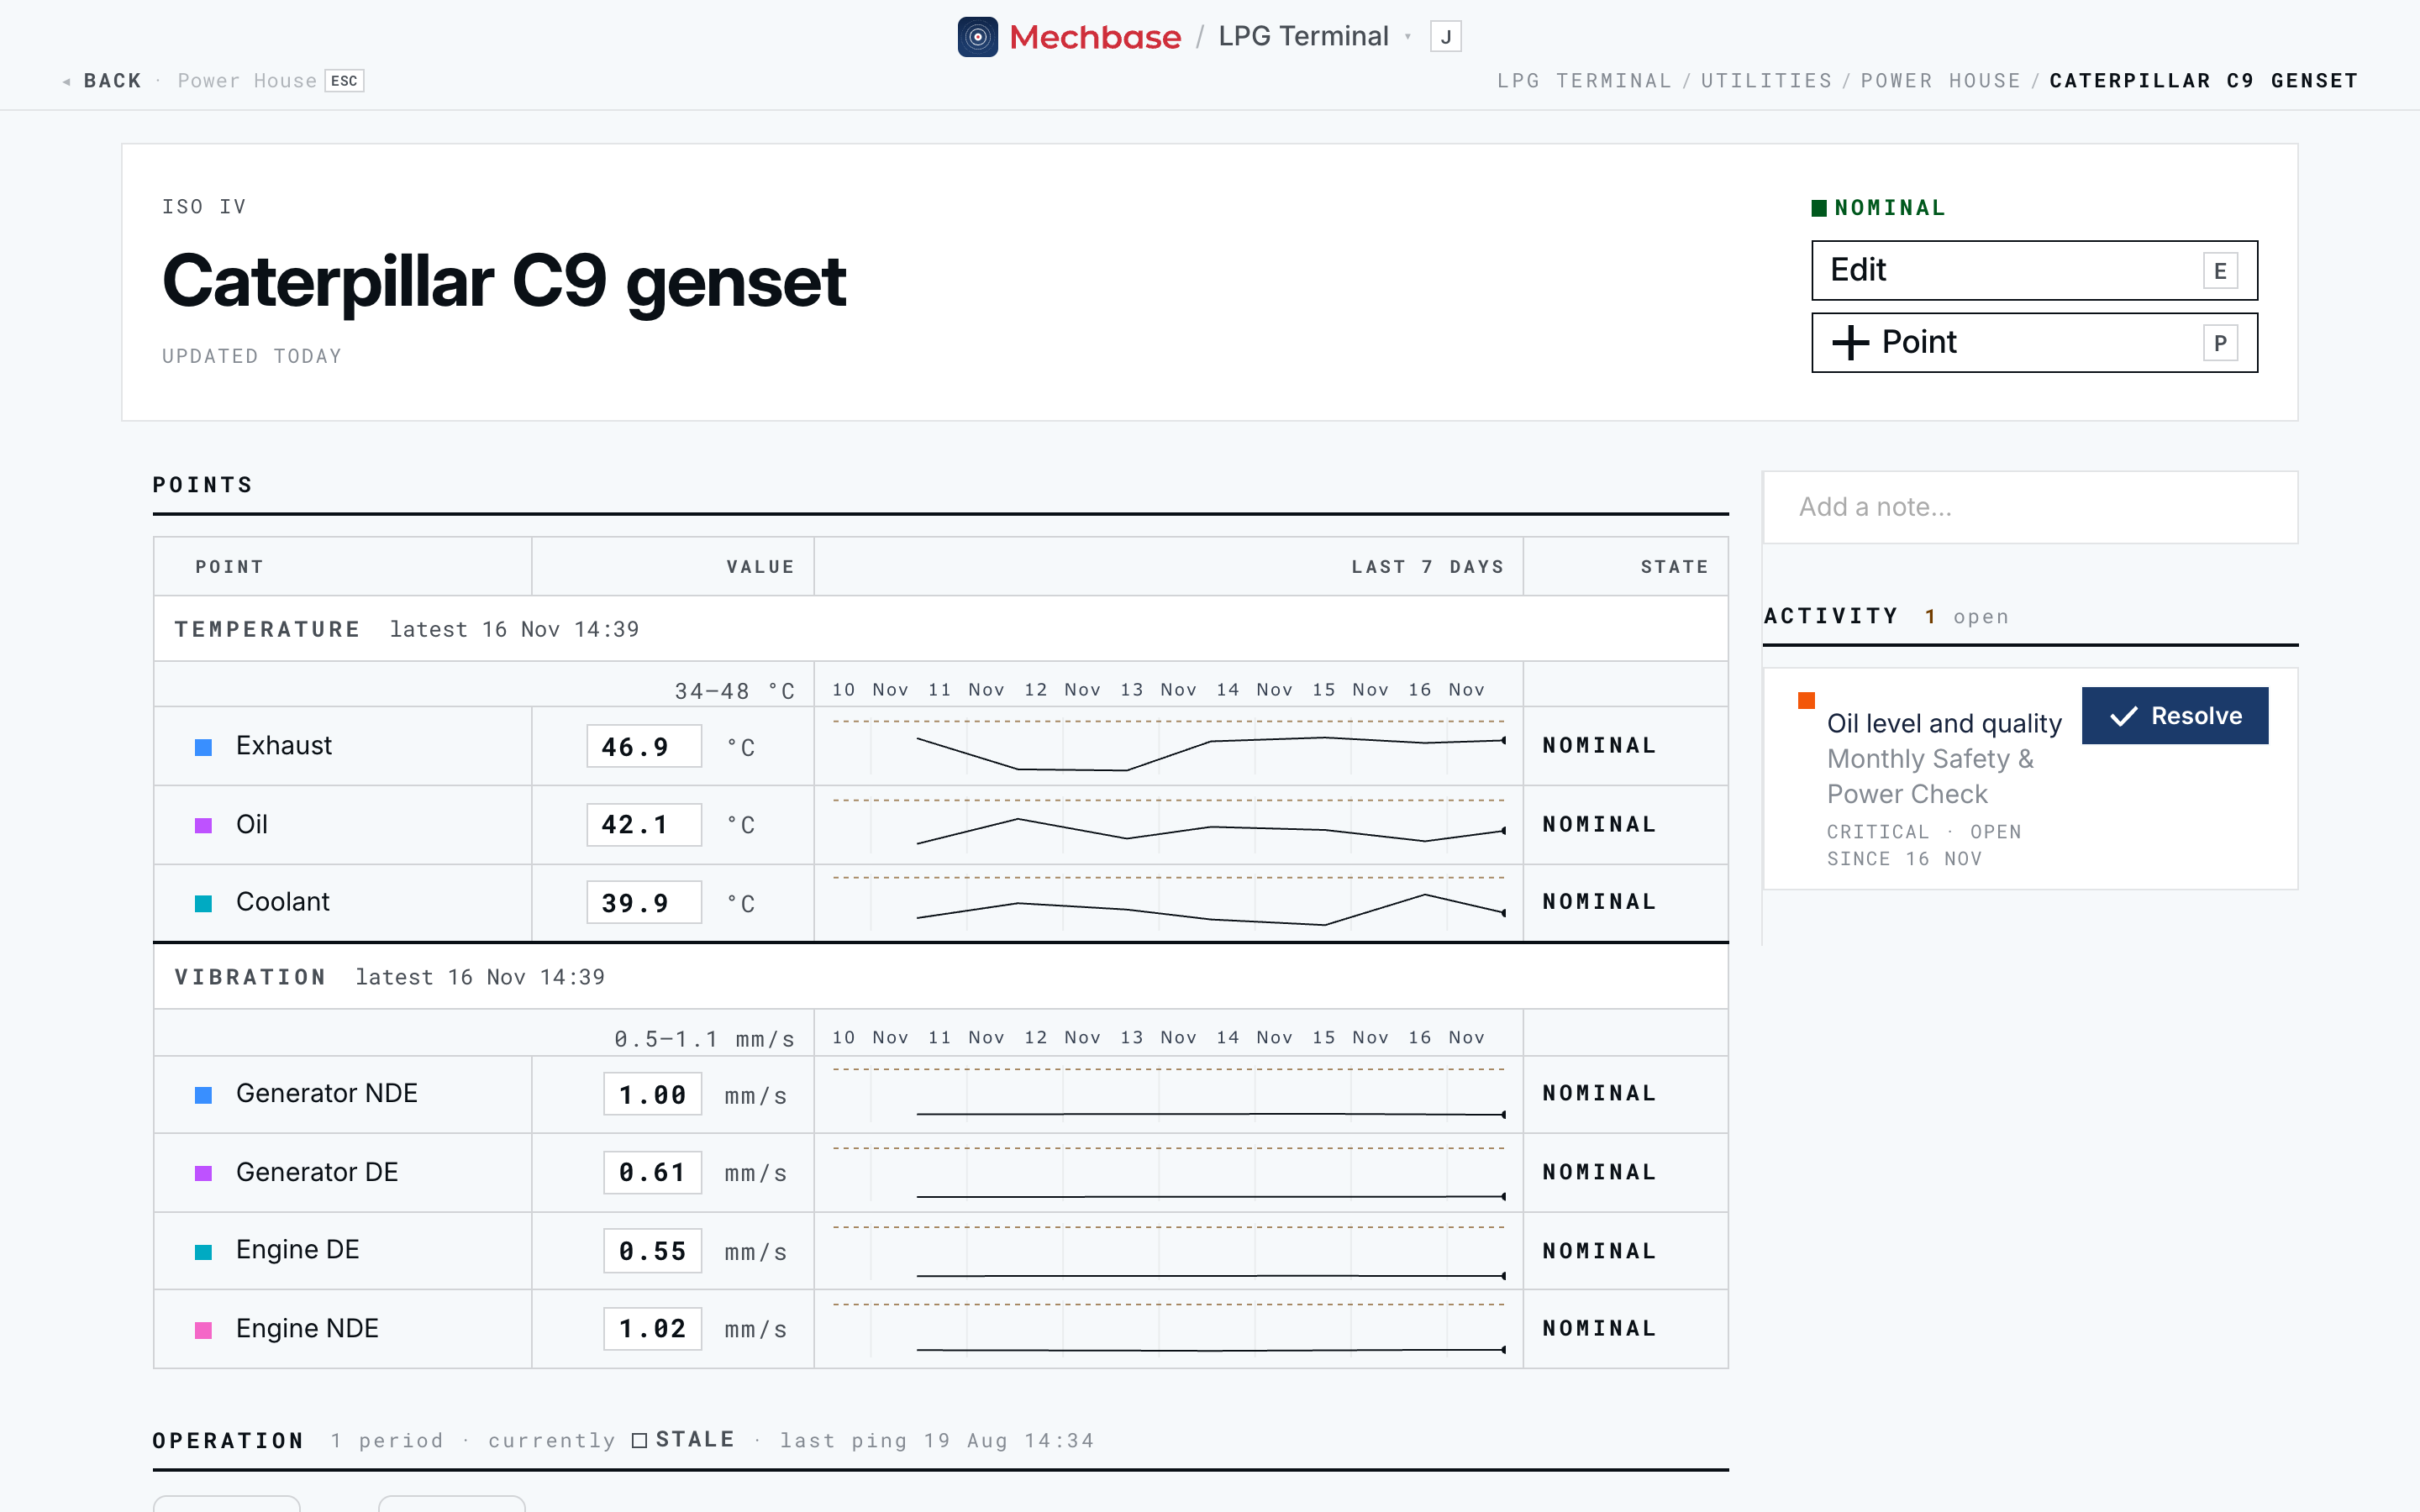
Open issues. Any non-conformities raised against the asset during inspections are pinned at the top of Activity, and the heading counts how many are open. Each shows the failed check (linking to the inspection report), the route, its severity — Warning or Critical — and how long it’s been open, with a Resolve button. Resolving asks for an optional Resolution comment; click Mark resolved and the item closes, with your name and comment on the record. Non-conformities come from routes — see Inspections and routes.
Activity. Below the open issues is the asset’s complete history, newest first:
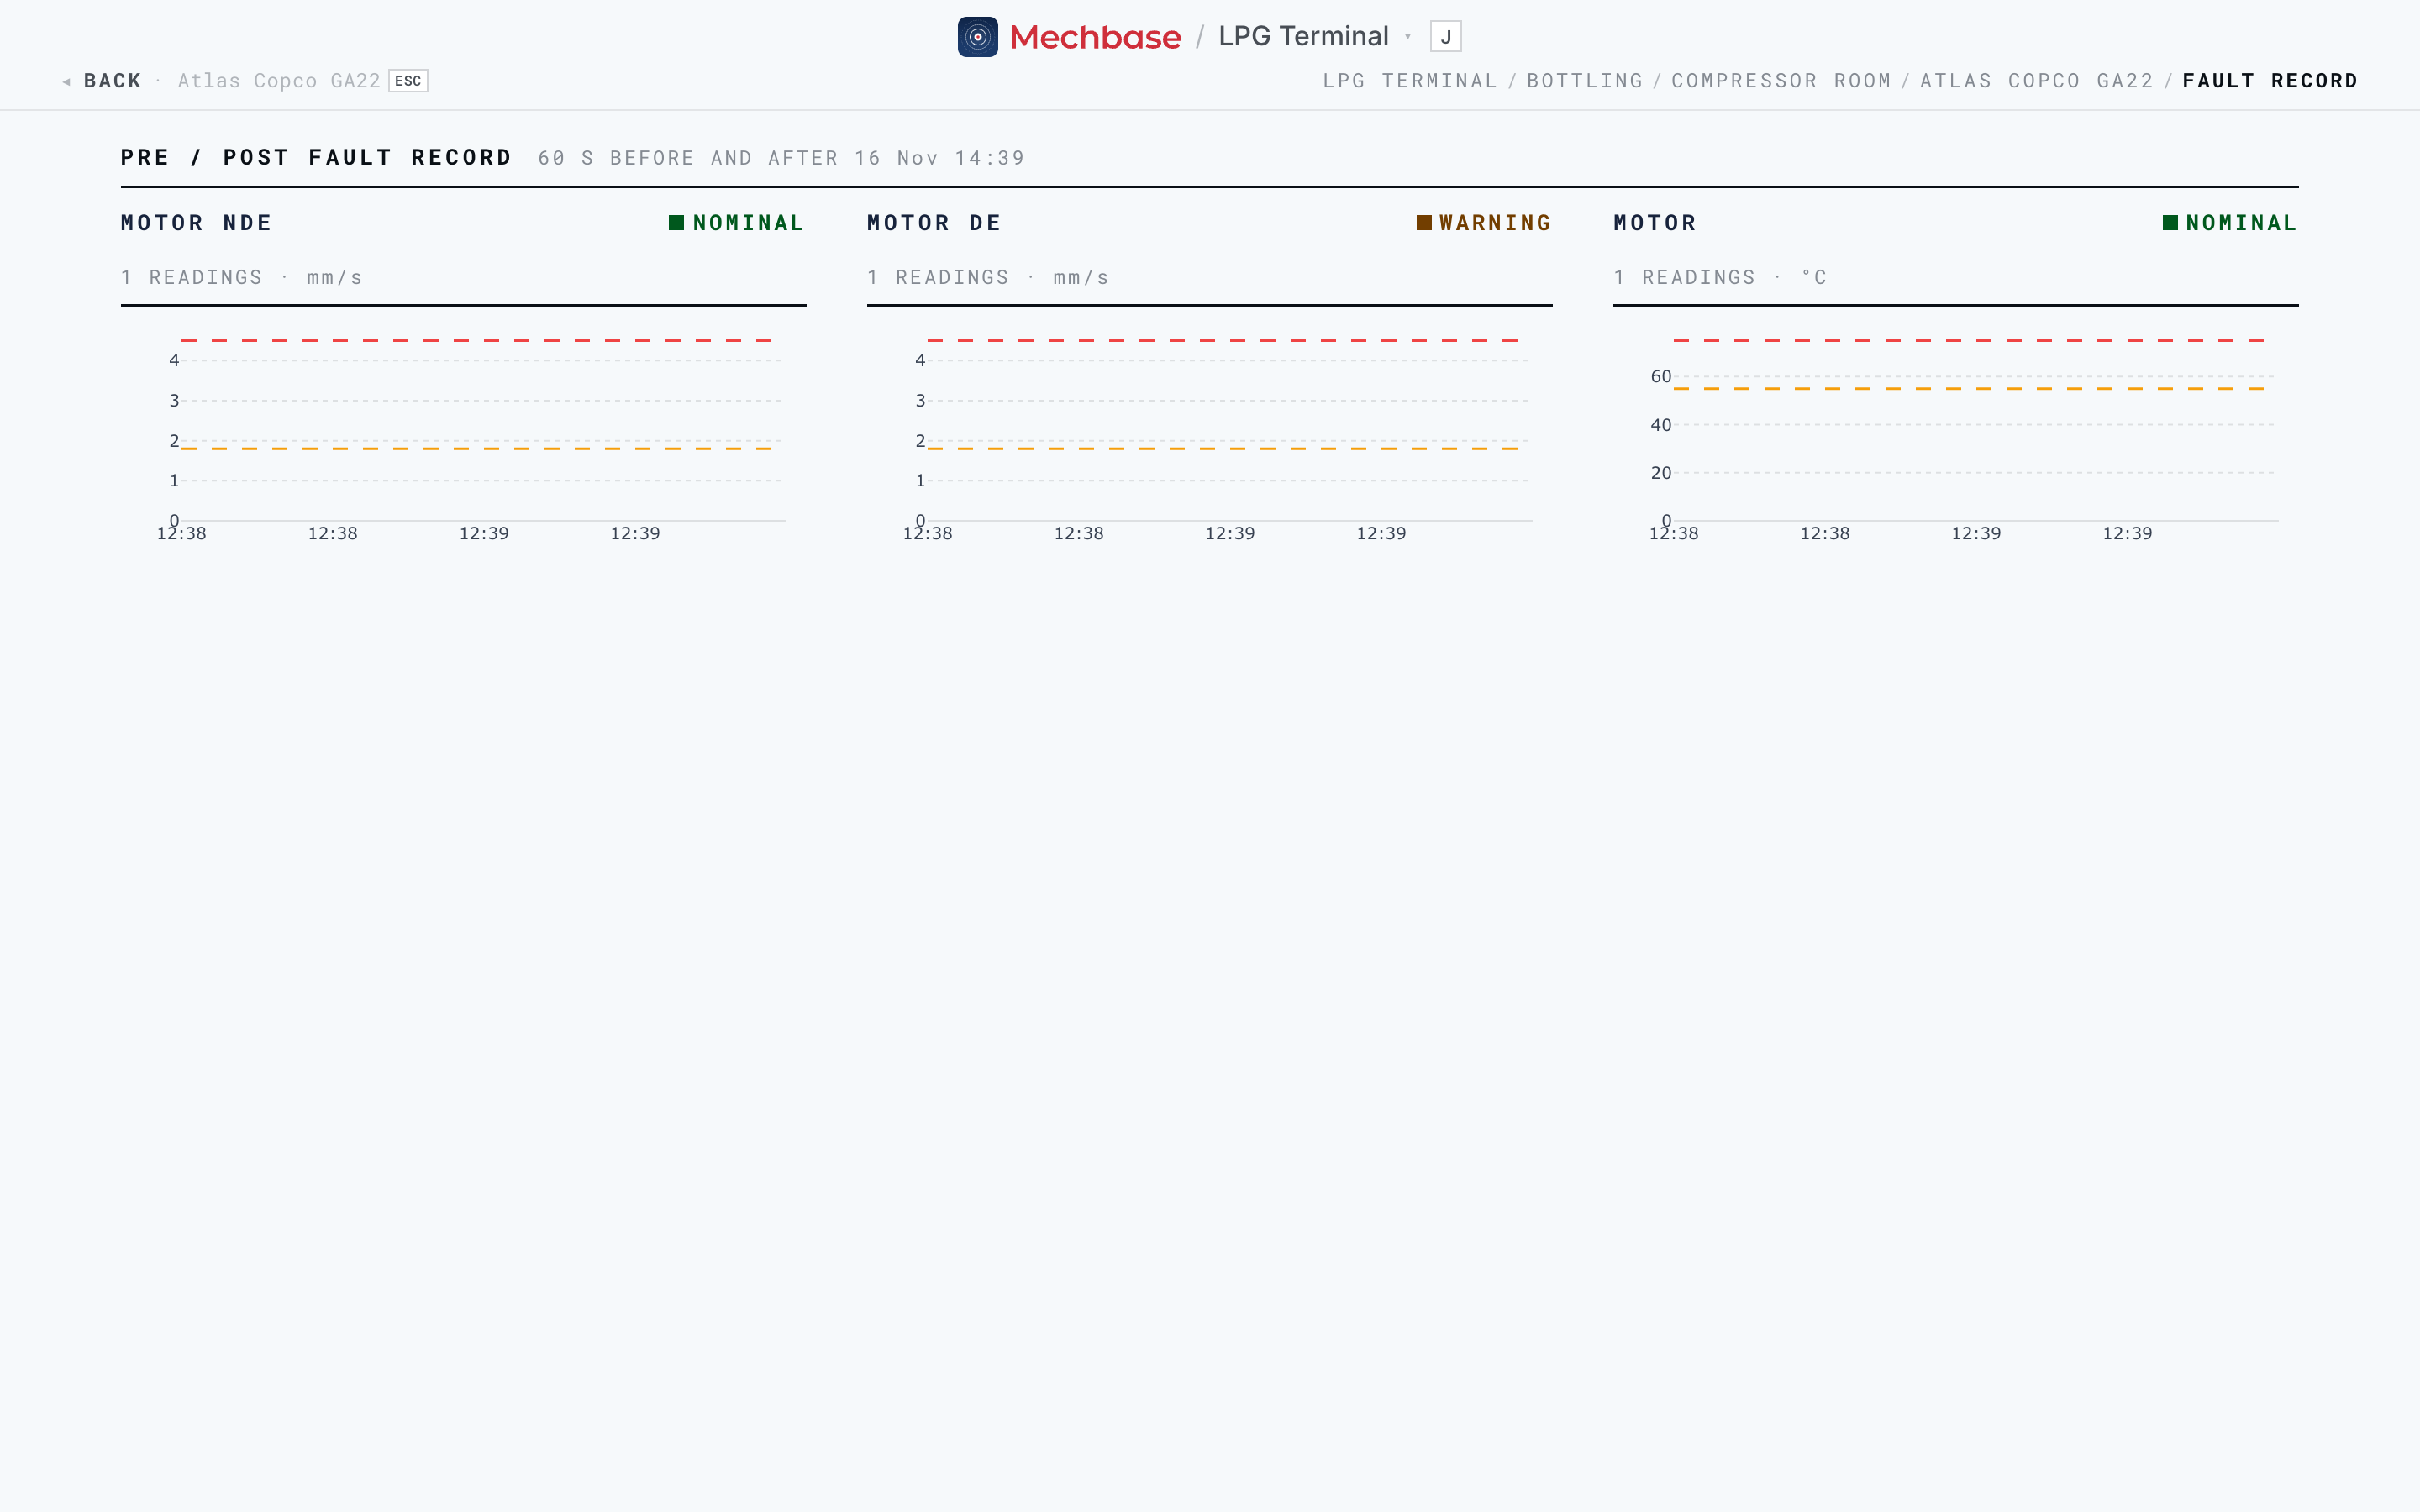
State changes in plain language — “Degraded to warning from Motor DE”, with the reason. Changes caused by a reading carry a fault record ±60 s link: a page of mini-trends showing every sensor on the asset in the minute before and after the change, so you can see what moved first.
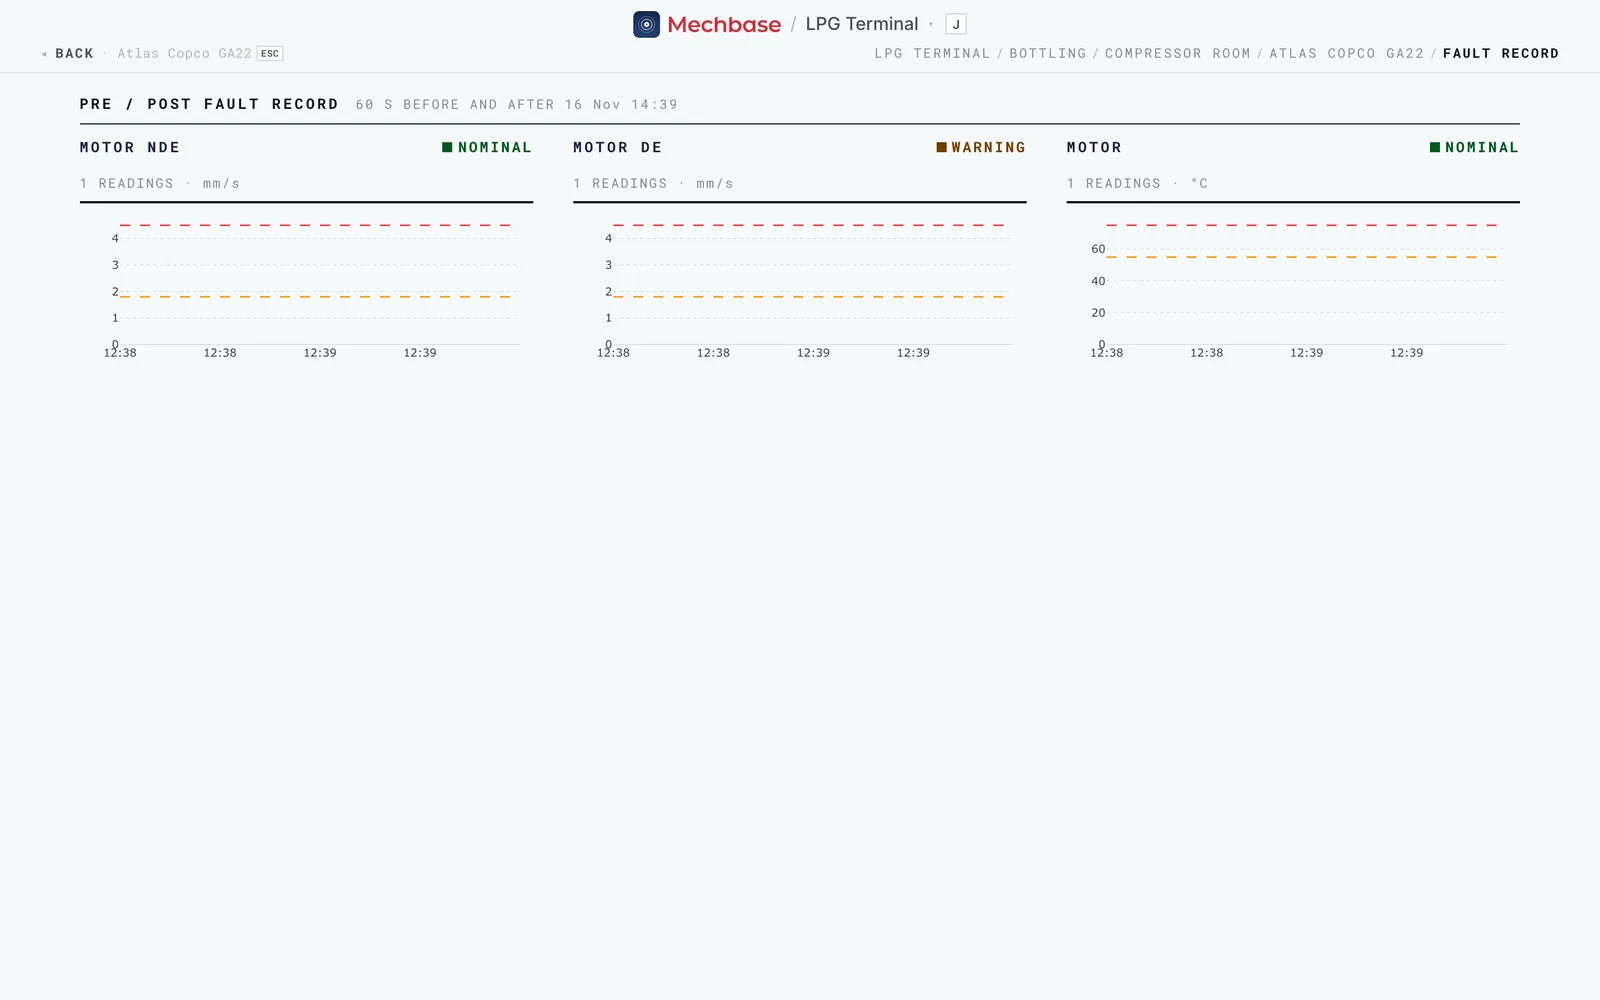
A fault record: every sensor on the asset, 60 seconds either side of a change Changes from inspections — “via inspection”, with who and when, linking to the report.
No readings from a point (and how often it was expected), and Readings resumed when it comes back.
Resolved non-conformities, with the resolution comment.
Bursts of changes fold into “+N earlier changes” so the list stays readable.
Measurement points and what each one watches#
A measurement point is one specific thing you measure, in one specific place on the asset — the drive-end bearing’s vibration, the motor’s temperature, the pump seal’s ultrasound. An asset usually has several, and each is named by its location.
Each point has a type (its transducer), and Mechbase groups points by type on the asset page. Mechbase supports a wide range, so you can capture almost anything:
Vibration — overall levels and full waveforms from rotating equipment.
Temperature and Thermography — contact temperature and thermal images.
Ultrasound — high-frequency sound, in dB, e.g. from a failing seal or bearing.
Pressure, Flow, Current, Voltage — process and electrical values.
Tachometer and Counter — shaft speed and counts.
Boolean — a simple yes/no reading.
State — an on/off signal such as a fault contact or a run lamp, recorded as periods (On since 06:12) rather than a trend.
Production — whether the machine is running; it drives the Operation panel and running hours. It isn’t offered when you add a point by hand.
Note: Vibration points only report alarms once the asset has an ISO 10816 class set, since that class defines the severity bands. You set it on the asset, and each point can inherit it or override it.
A point’s own page#
Click a point to open it. This is where you read its numbers and history.
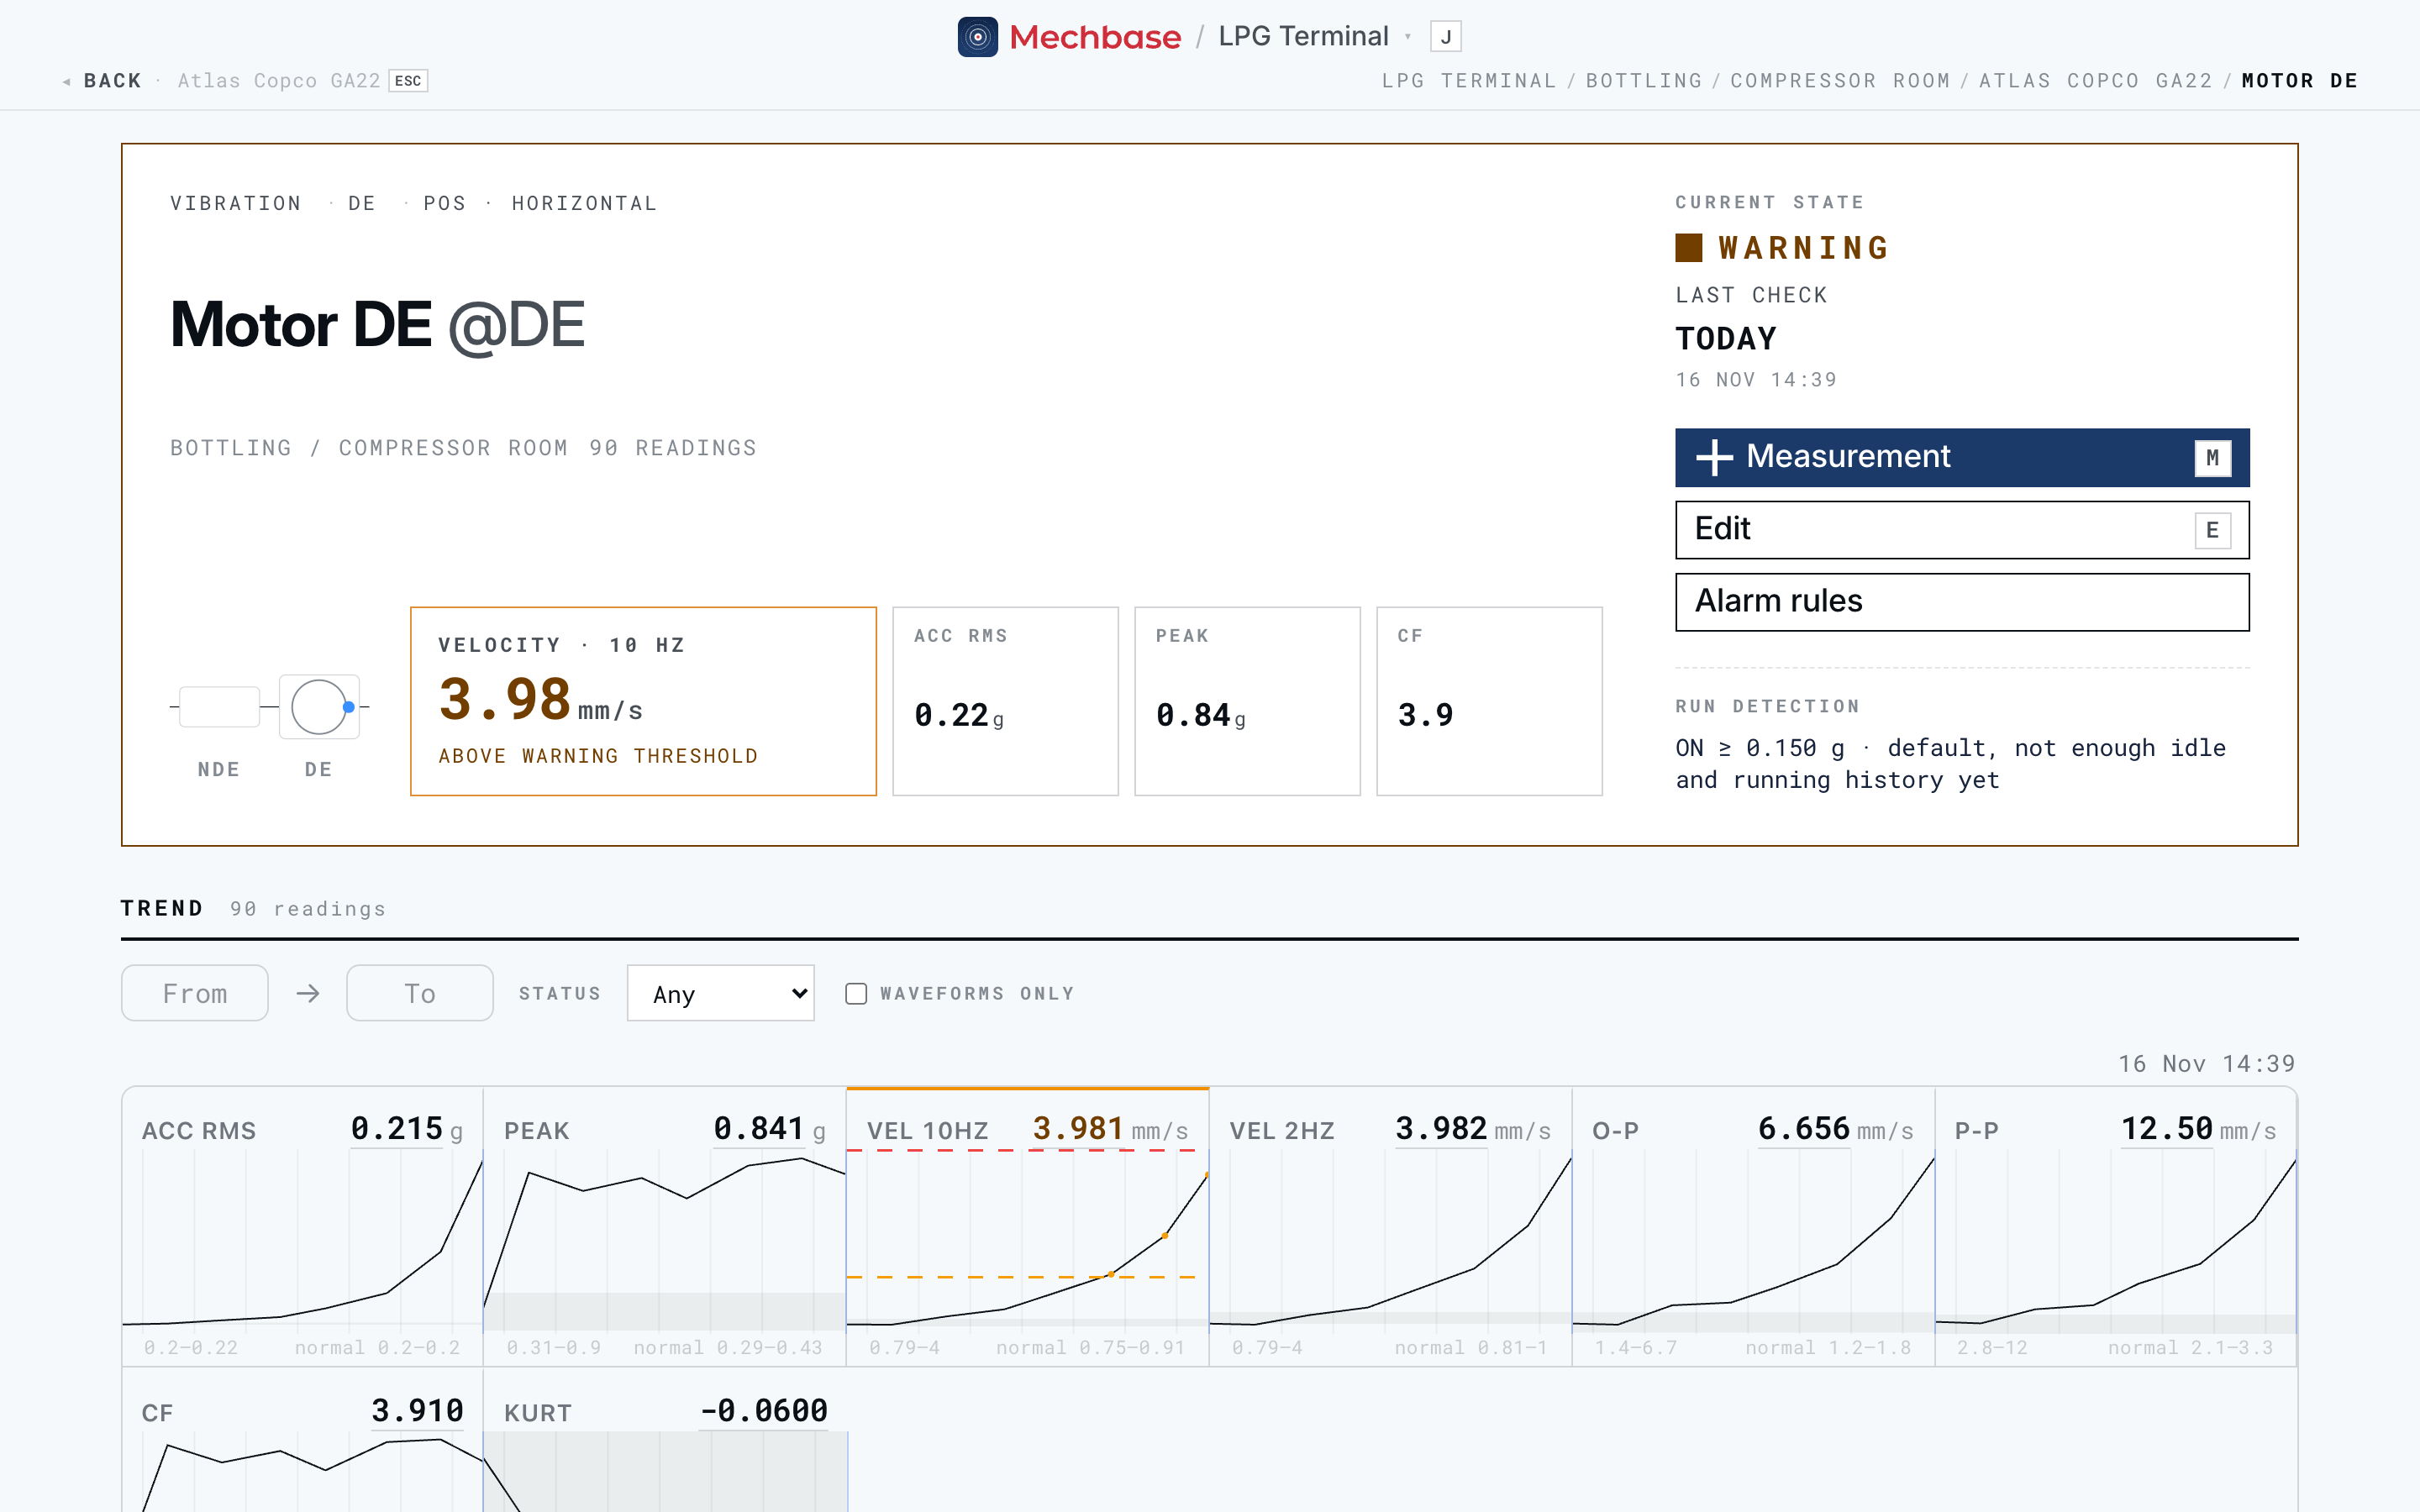
At the top you get an honest headline: the value that matters for this point (for vibration, the velocity at 10 Hz, with its relation to the limit — “Above warning threshold”), the other key values beside it, the current state, and when it was last checked. If the machine is stopped, the headline says so and shows the state at last run instead of a meaningless stopped reading; if the feed has gone quiet, it says No data and since when.
Alongside:
Measurement (
M) — record a reading by hand, right there on the page.Edit (
E) — change the point.Alarm rules — see and change the limits (Measurements, trends, and alarms).
Sources — where data arrives from automatically (“Compressor room node, CH 0” or “MQTT LPG-TM-001, CH 1”), with a live dot when it’s reporting.
Run detection (vibration points) — how this sensor tells running from stopped; see Running state and operating hours.
Below the headline are the point’s trends, and below those the list of readings, grouped by day and by run. Reading those properly — and the vibration analysis tools — is the subject of Measurements, trends, and alarms.
Running state and operating hours#
Mechbase works out on its own whether each machine is running, because so much depends on it: vibration readings only mean something while the machine runs, stopped readings shouldn’t raise alarms, and running hours drive maintenance intervals.
It decides in this order:
A tachometer, if the asset has one reporting. A shaft-speed reading above zero means running. While the tachometer has reported in the last ten minutes, it has the final say.
A run signal, such as a contactor or a PLC bit, wired to a MaintNode or sent from your own system.
The vibration itself. Each vibration sensor learns, from its own history, the level that separates idle from running on that machine. The point page shows this as Run detection — for example “ON ≥ 0.150 g · default, not enough idle and running history yet” while it’s still learning, and the learned idle and running levels once it has enough. If a sensor only ever fires when a neighbouring machine runs, Mechbase says so (“Not used: … Check where it is mounted”) — usually a sign it’s mounted on the wrong machine.
You can always correct the current period by hand with Set ON / Set OFF in the Operation panel.
Operating hours. Running time accumulates automatically and is totalled on the Hours page (Finding your way around). If a machine has a physical hour meter, record its reading on a route or by hand on the running-hours point: Mechbase takes it as the new total and carries on counting from there.
Adding a section, a zone, or an asset#
You build out a site from the top down: add sections, add zones inside them, then add assets inside the zones.
Add a section from the menu, under Sections → Add a section.
Add a zone from a section page, using Add Zone (
Z).Add an asset from the Add asset row at the bottom of a zone on the section page: type its name in the small New asset dialog and click Add asset.
The new asset appears in place, ready to fill in. Open it and click Edit to set its type, class, and topology (next section), then add points with Point.
Tip: Large sites don’t have to be typed in by hand. A room or equipment list in Excel can be imported as zones in one go — see Setting up and managing your account.
Editing an asset#
Open the asset and click Edit (E).
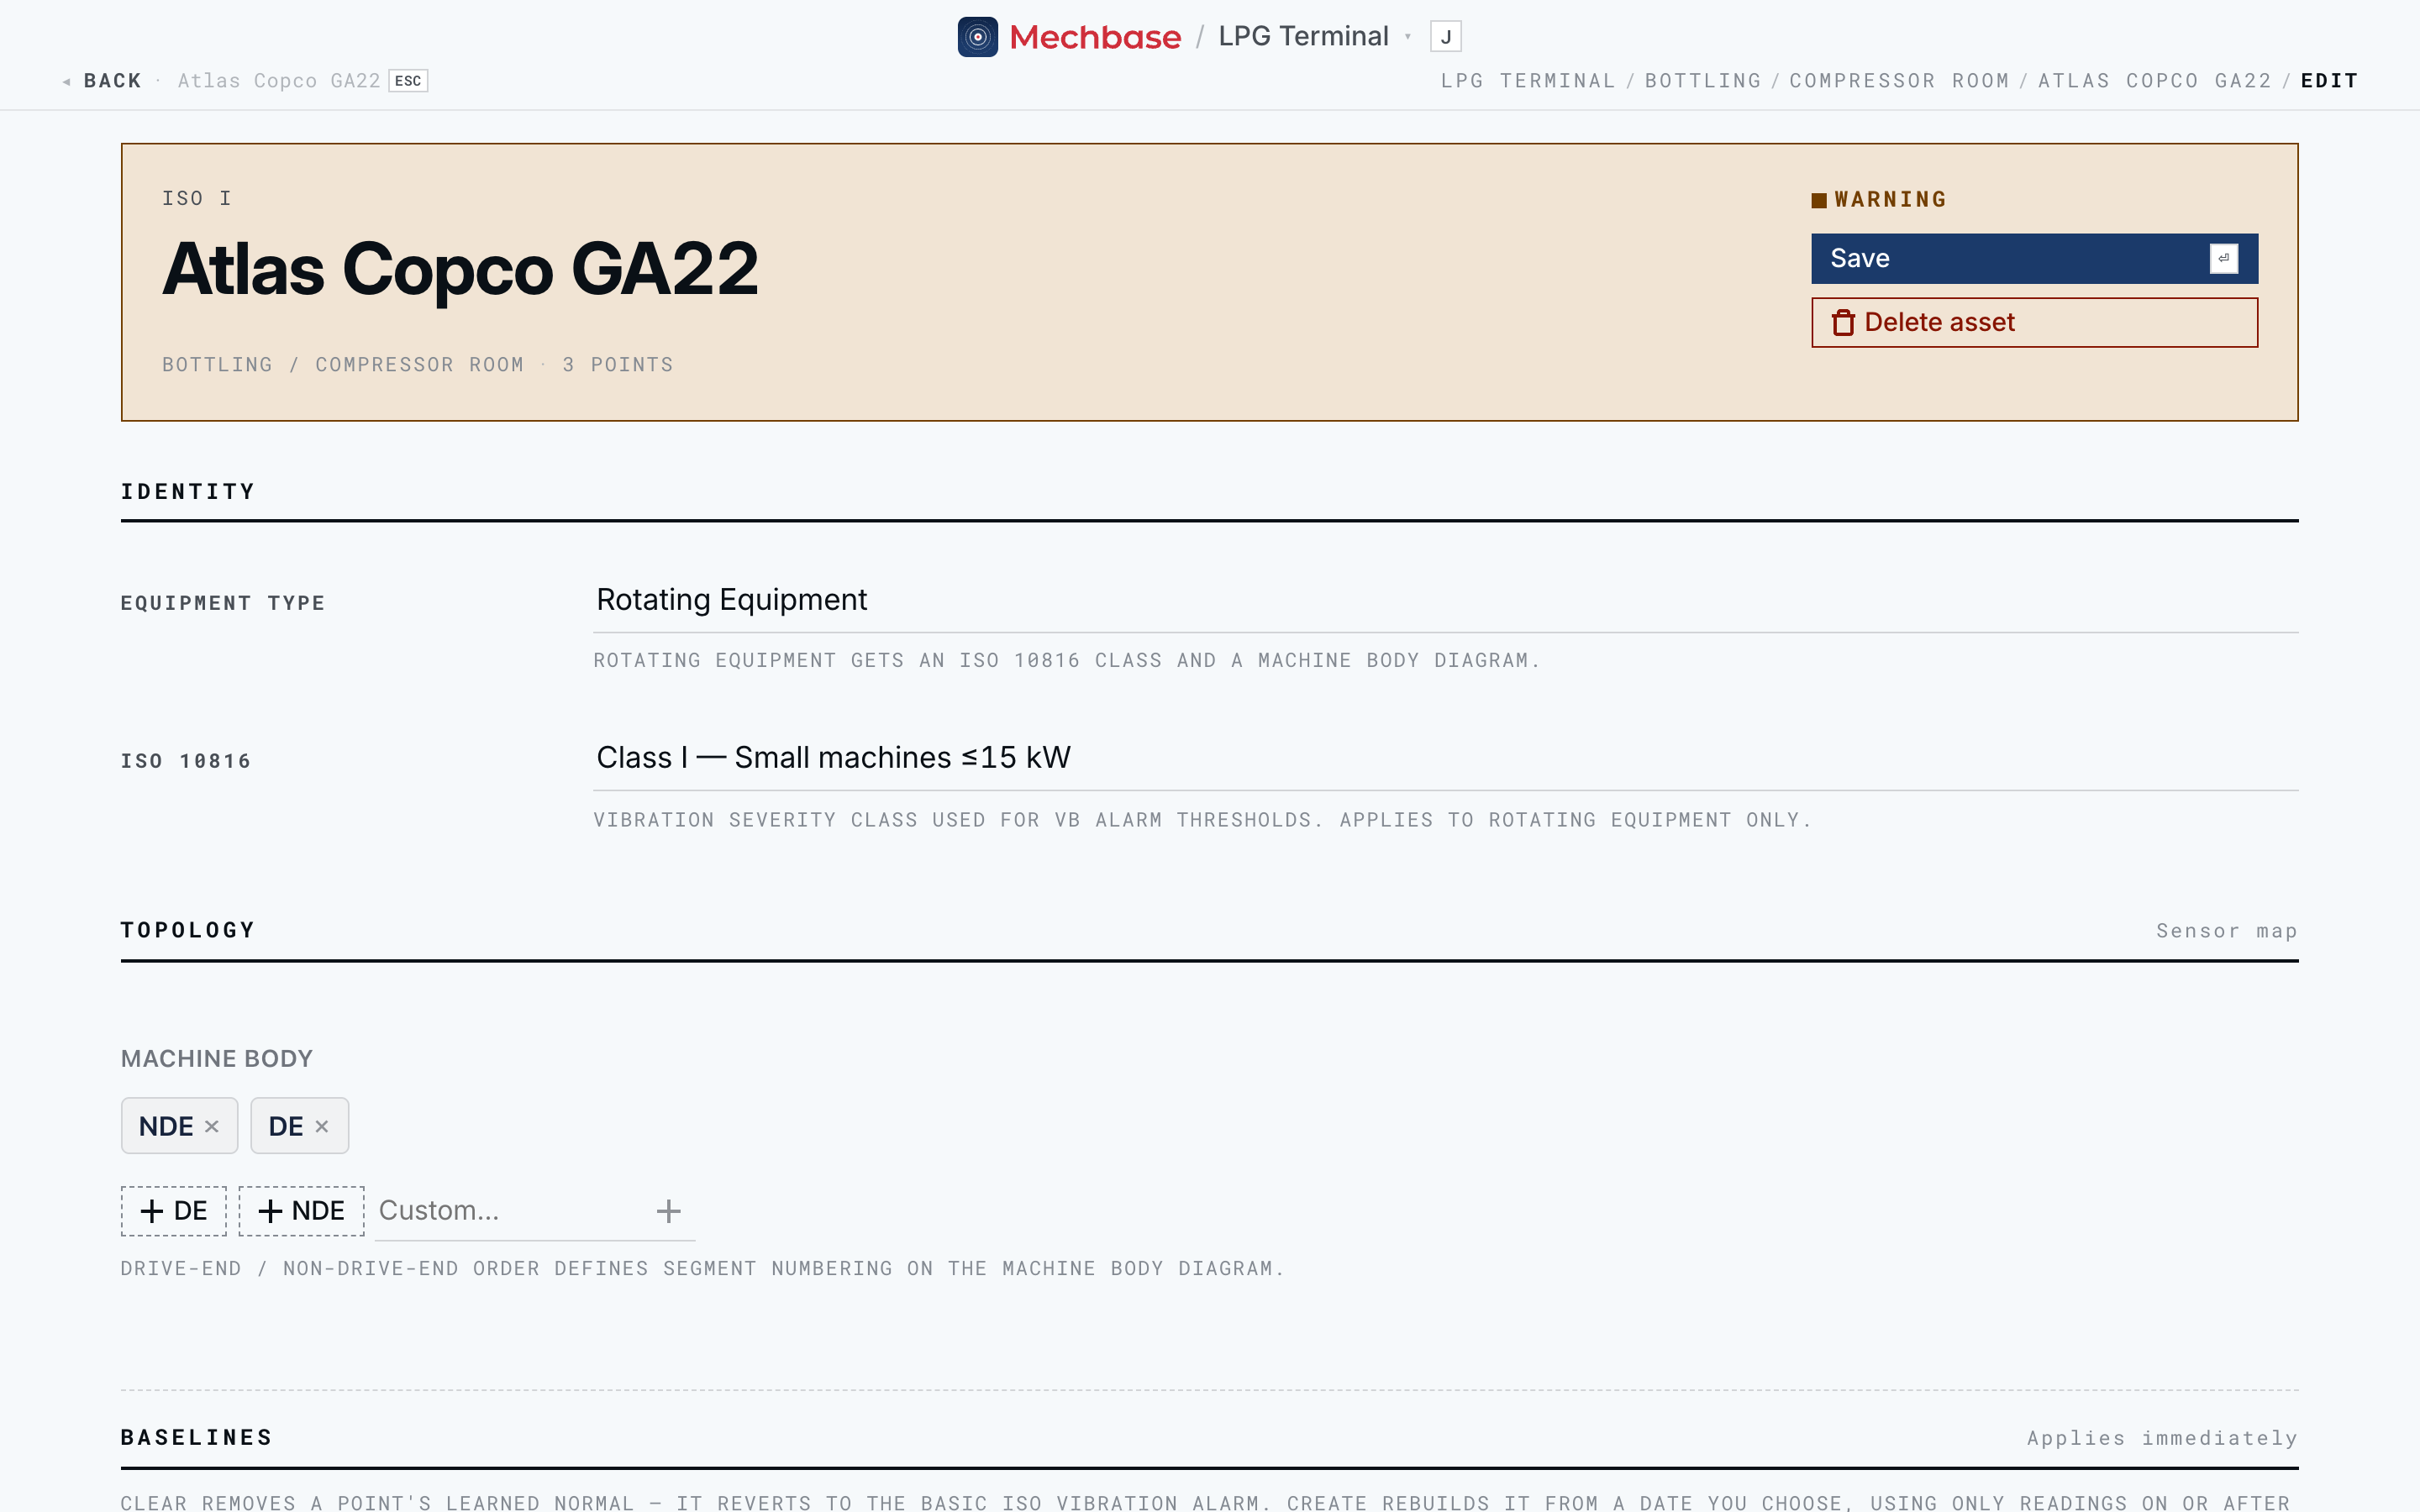
Identity — the Equipment type: Rotating Equipment, Electrical Equipment, Static Equipment, or Infrastructure. Only rotating equipment gets an ISO 10816 class and a machine body.
ISO 10816 — the vibration severity class (Class I, small machines, through Class IV) that sets the default vibration alarm bands.
Topology — the Machine body: the drive-end and non-drive-end segments that become the bearing diagram and decide where points sit. Add segments with + DE, + NDE, or a Custom… name, in order along the shaft.
Baselines — for each vibration point, the learned “normal” that relative alarms compare against. Clear reverts a point to the basic ISO alarm; Create from date… relearns it from a date you pick — useful after a repair, or to escape a period of bad data. Mechbase tells you how many usable readings there are since that date (it needs 100) before you commit.
Click Save to keep your changes.
Heads-up: Delete asset removes the asset with all its points and history. An asset that already has recorded readings can only be deleted by a staff user, who must type the asset’s name to confirm.
Adding and editing a measurement point#
On an asset page, click Point (P). A small dialog asks for the Transducer
type, the Location (“e.g. Motor, Bearing 1”), and — for rotating equipment —
where it sits on the machine body. Click Add point and it appears in the list.
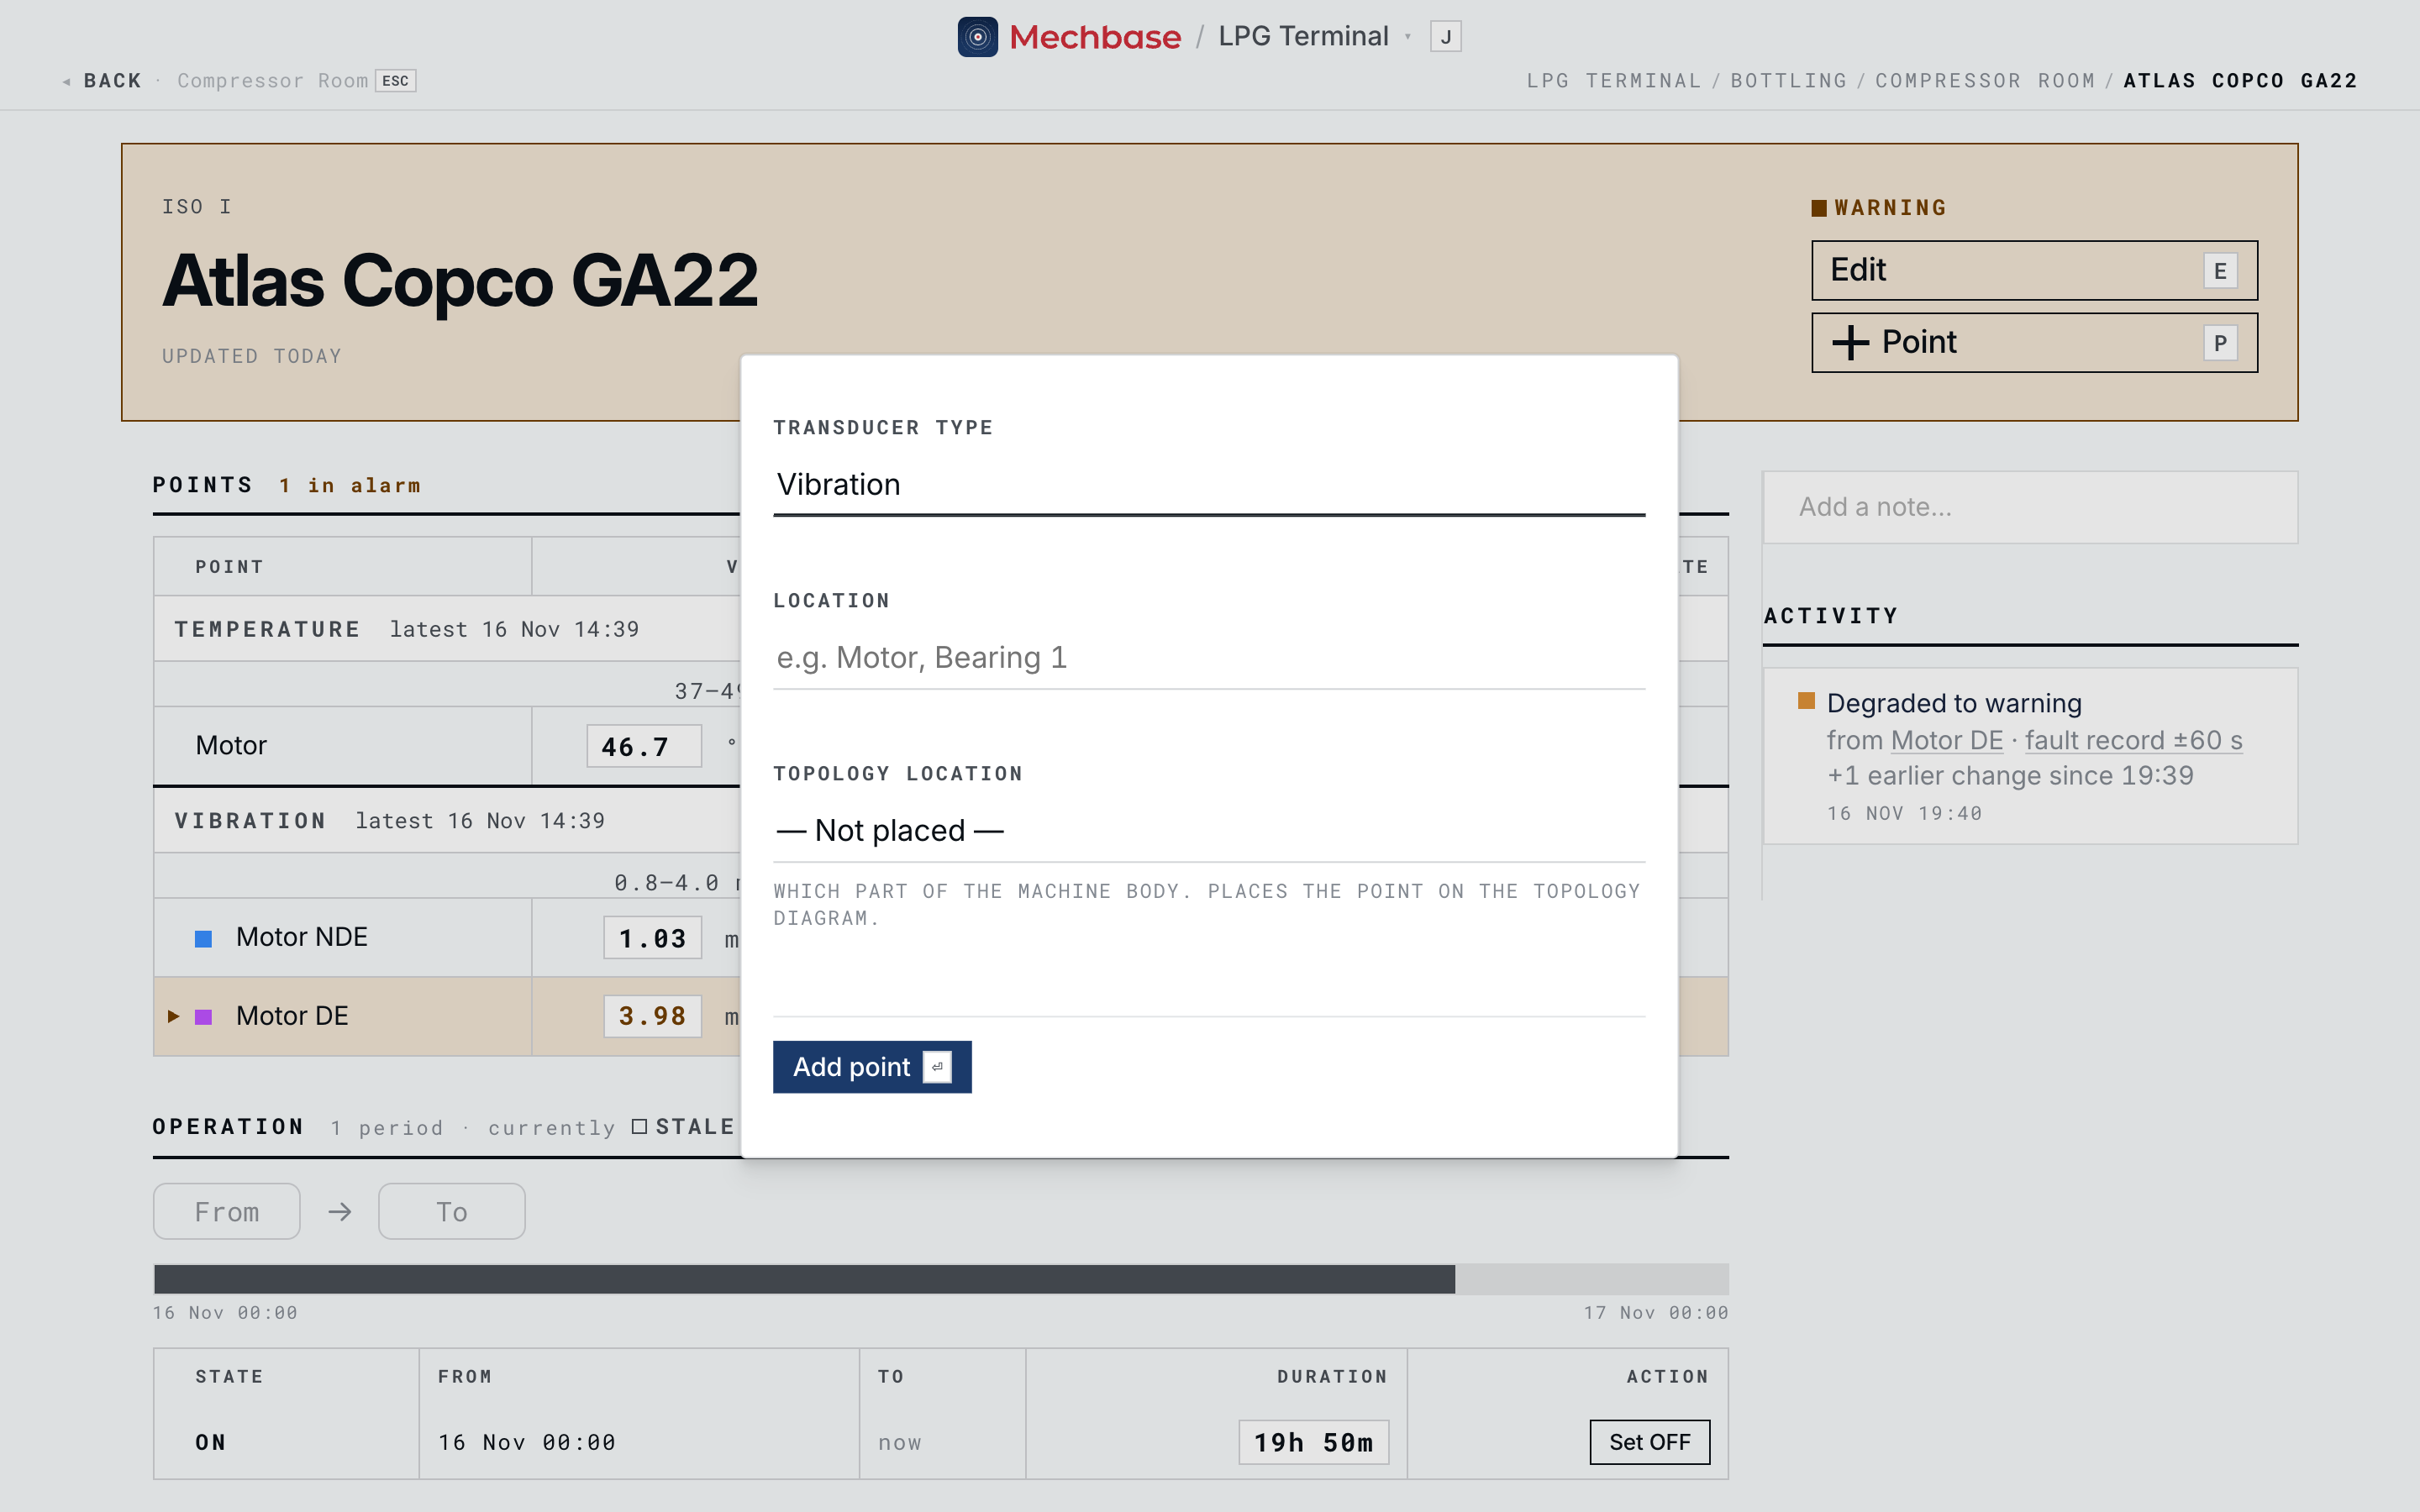
To change a point, open it and click Edit (E). The edit page is one
scrollable form:
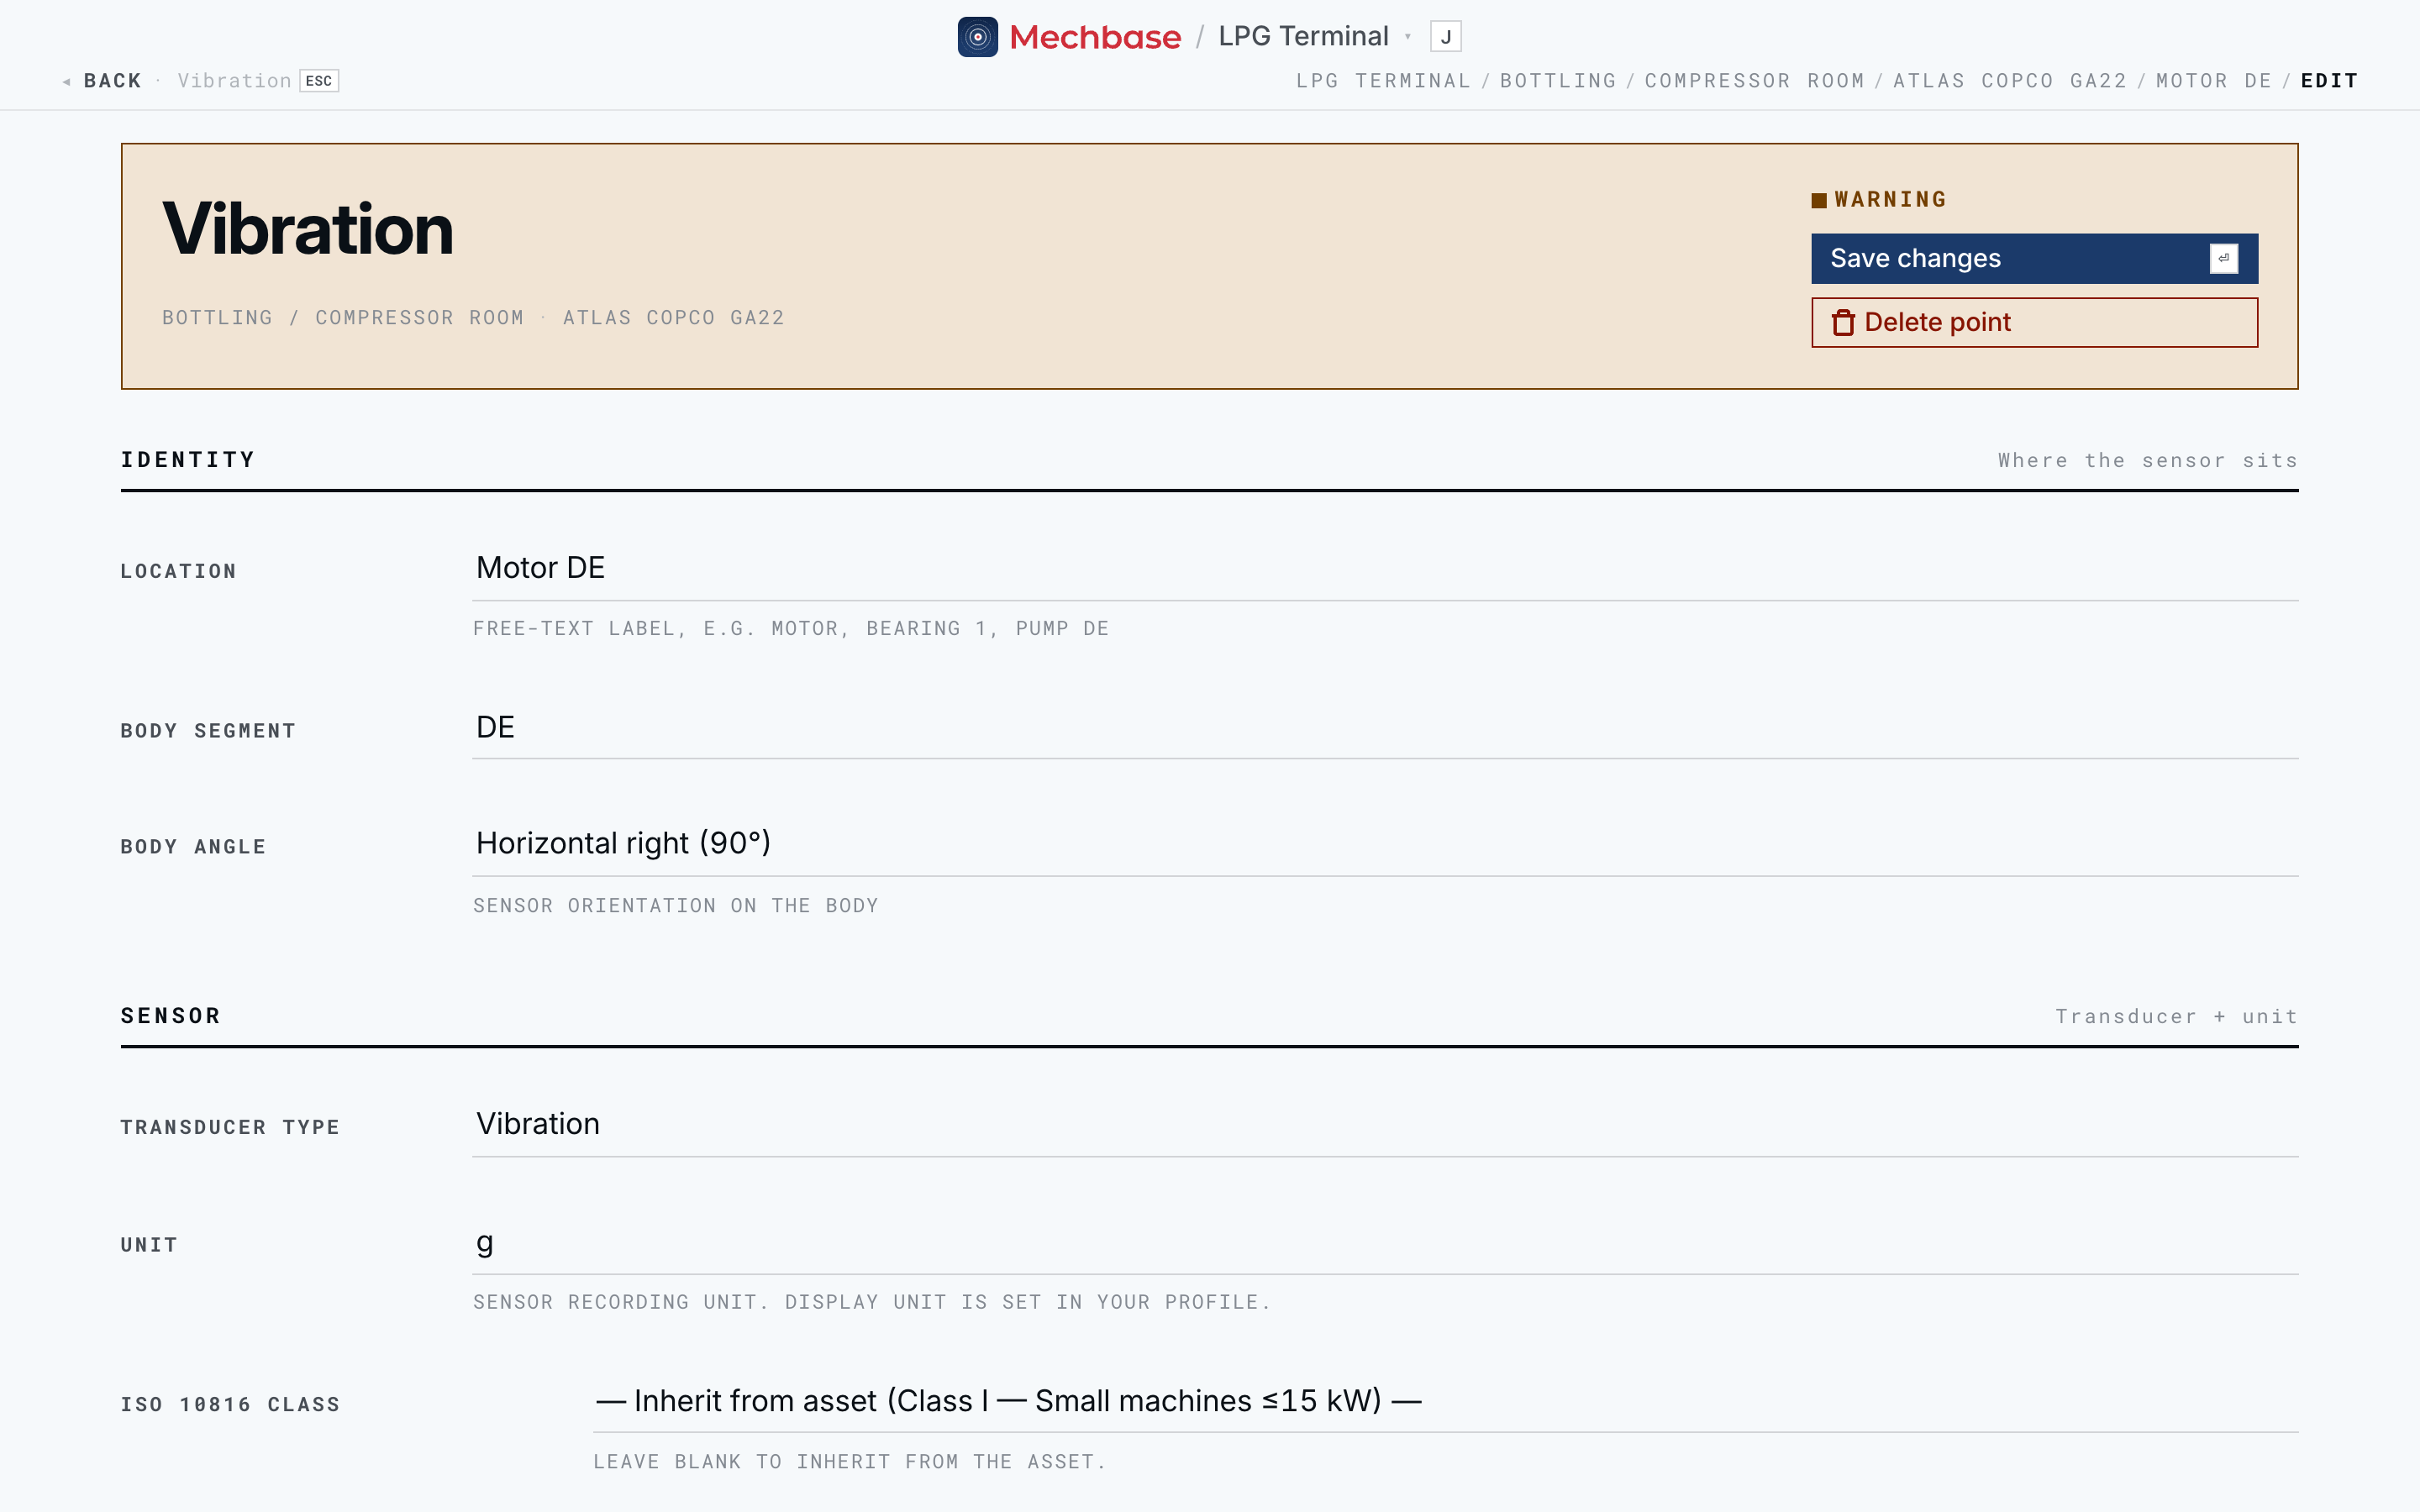
Identity — where the sensor sits. The free-text Location (Motor DE), and optionally the Body segment (NDE/DE) and Body angle (top, horizontal, bottom, axial) so Mechbase knows exactly where on the machine the sensor is.
Sensor — transducer and unit. The Transducer type, the Unit the sensor records in (the unit you see is set in your profile), and the ISO 10816 class (inherit from the asset, or override).
Shaft & bearing (vibration points). The Nominal speed in RPM from the nameplate; the Bearing fitted at this point, picked from the bearing library (Measurements, trends, and alarms); a Speed ratio if the bearing sits behind a gearbox or belt; and the Envelope band used to demodulate bearing faults (500 Hz–10 kHz if left blank).
Instructions. Rich-text guidance shown to whoever takes a reading here — on the web and on the phone. Worth filling in for anything non-obvious: where to put the probe, which axis, what to watch for.
Photo. A reference image of where the sensor goes, shown next to the instructions.
Sources. Where automatic data comes from (next section).
Save changes (Enter) keeps your edits. Delete point removes it after a confirmation.
Heads-up: Deleting a point removes its readings and history too. If you only want to stop using it, consider whether editing is enough before you delete.
Tip: Good instructions make field readings consistent. For vibration, say where the load zone is and which way the sensor’s X axis points; for thermography, say what to compare against (the other phases, the twin bearing); for ultrasound, say which probe and how hard to press. The same spot, the same way, every visit.
How a point gets its data: sources#
A point can be fed two ways.
By hand. Anyone taking a reading — on the web with Measurement, or out in the field on the mobile app — records the value directly. The instructions above are there to make those manual readings consistent.
Automatically, from a source. At the bottom of the edit page, Sources lists the live feeds connected to this point. Each row shows where the data comes from — a MaintNode device, its acquisition group and channel, and the sensor type; or an MQTT device and channel — and when it last reported. Click Add source to connect one, or the pencil to change it.
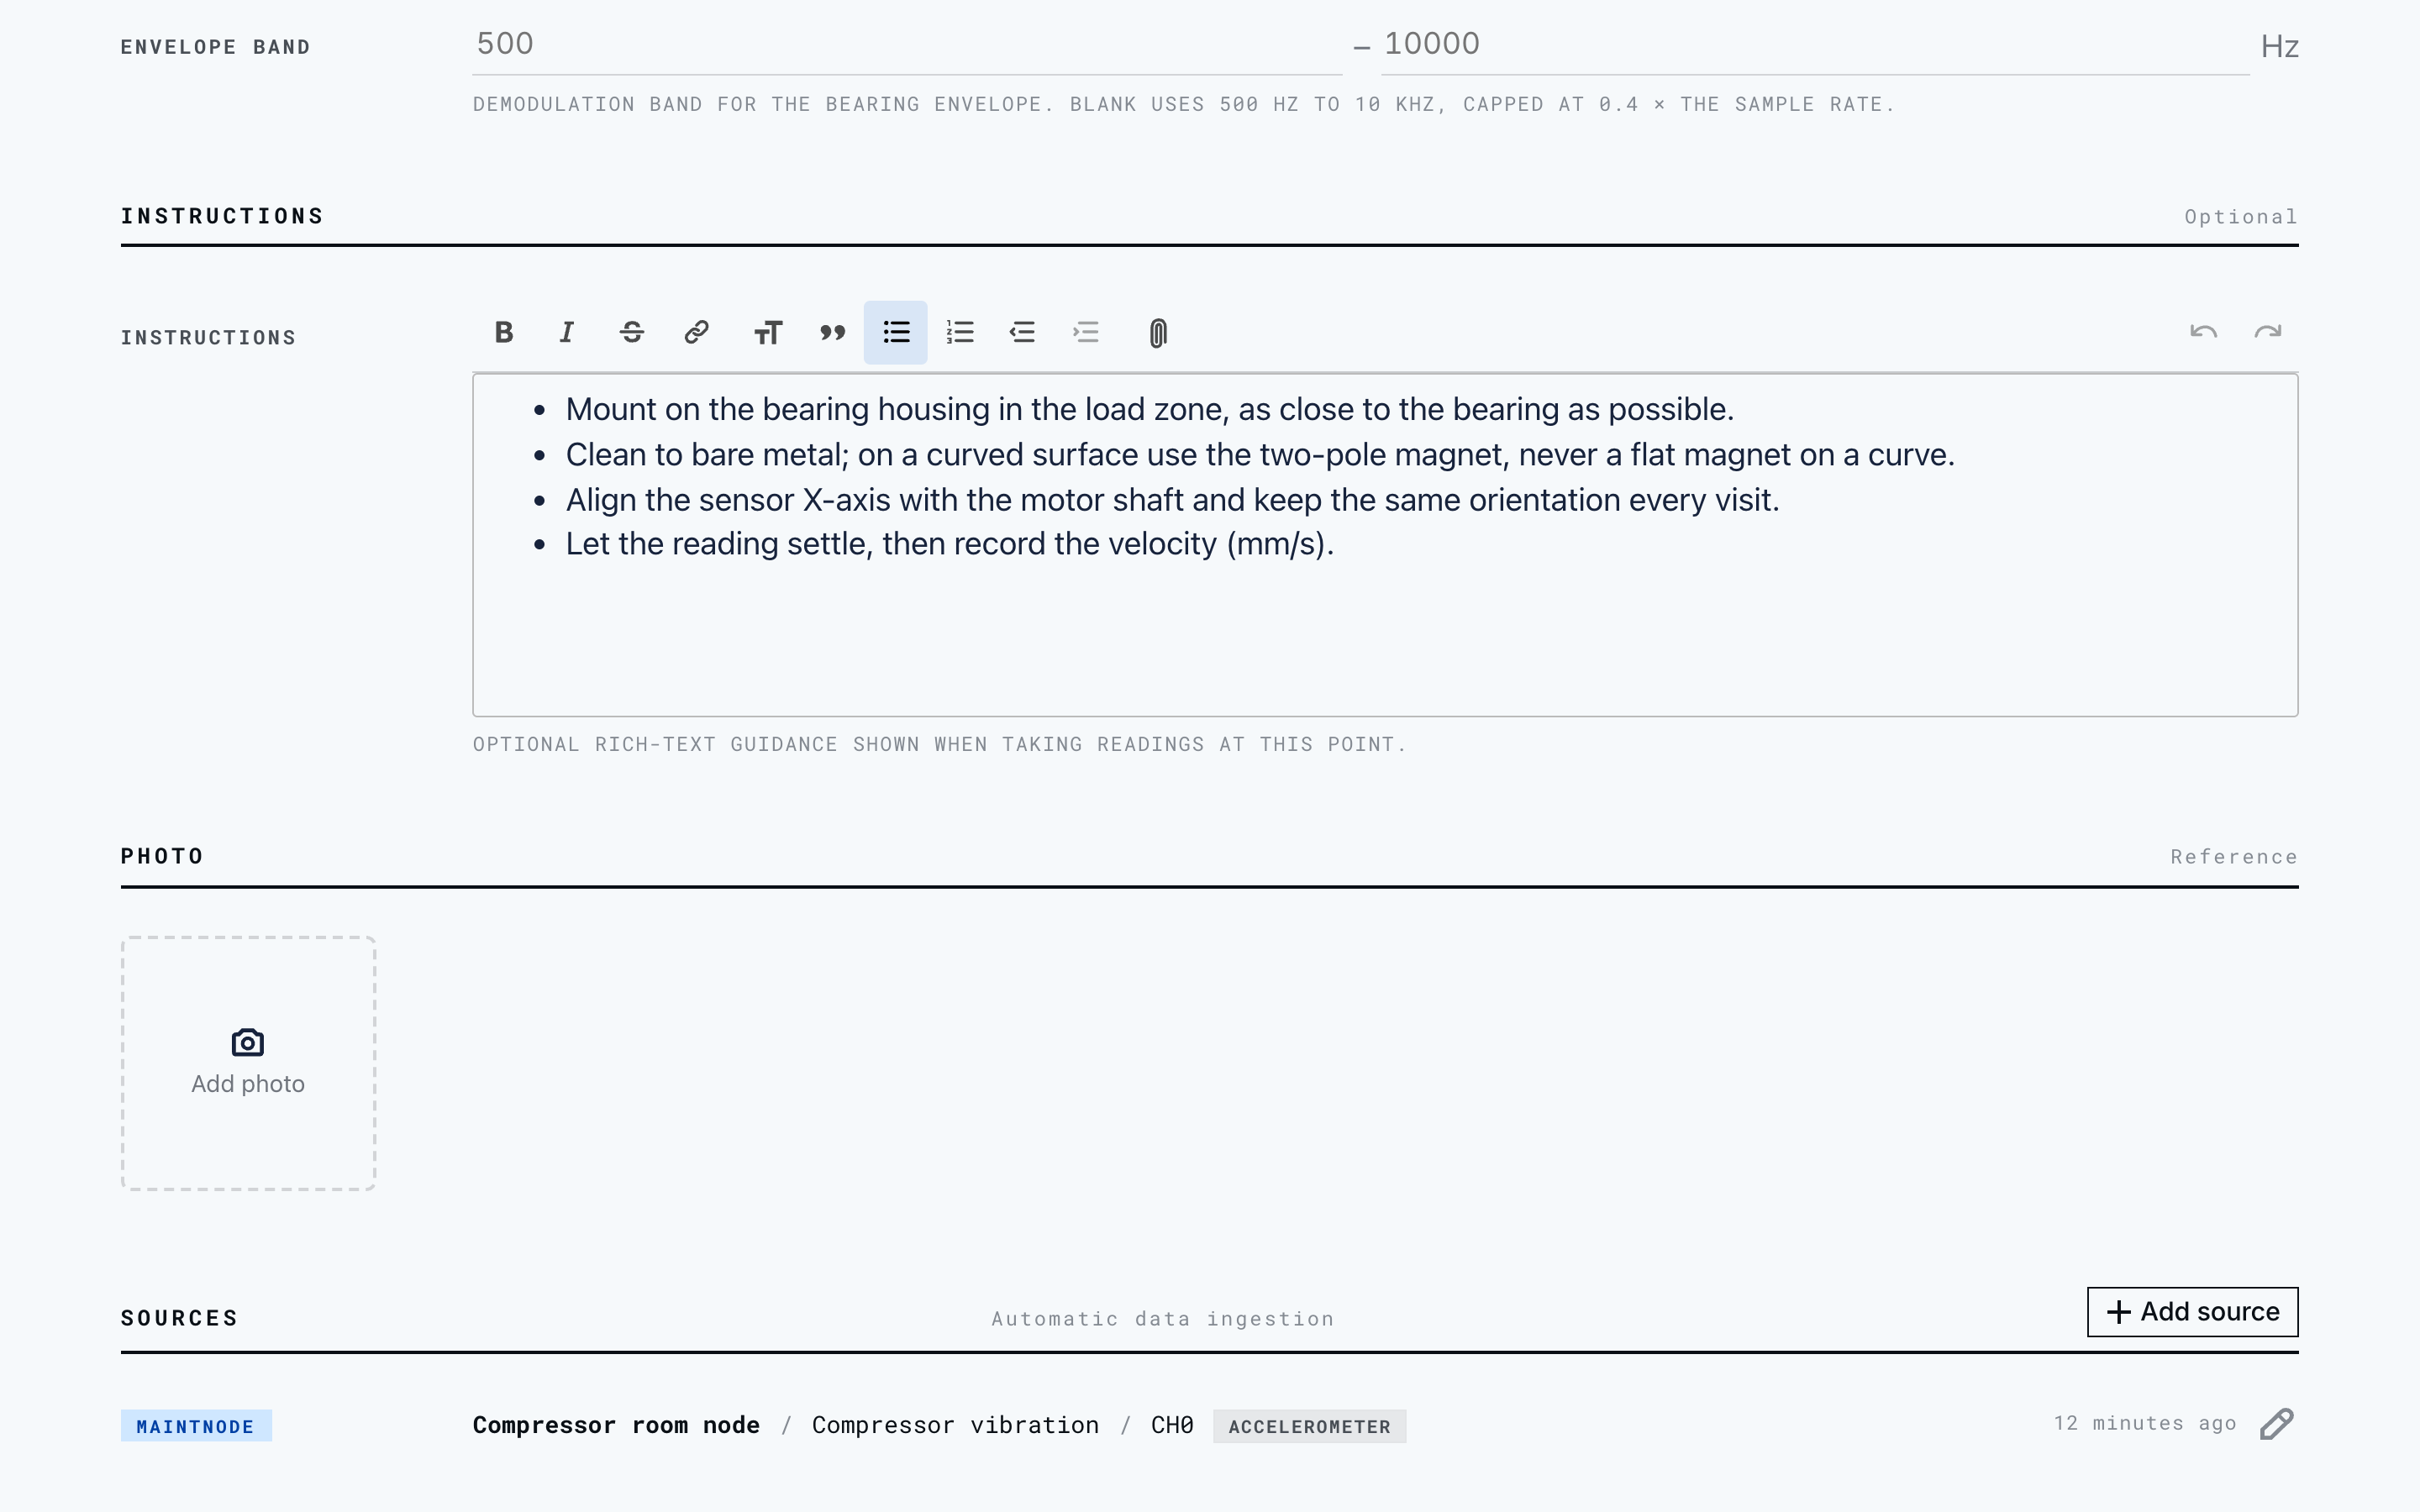
These automatic sources are how MaintNode devices and your own systems feed readings straight into Mechbase without anyone typing them in — covered in MaintNode devices and automatic data.
Whichever way a reading arrives, it’s treated the same: it’s added to the point’s history, checked against the alarm limits, and — if it crosses one — it updates the asset’s state and shows up in the activity feed.