2 · Finding your way around#
Mechbase models every site the same way — installation → section → zone → asset — and once that hierarchy and the health colours are clear, everything else (measurements, routes, what needs attention, the field apps) falls into place. This chapter walks that structure, shows how the colours behave, and introduces the site-wide views that cut across it: Points, Hours, and Dashboards.
Opening a section#
A section is a major area of the site — a process unit, a building, or a functional group like Utilities. Open one from its card on the home page, or from Sections in the menu.
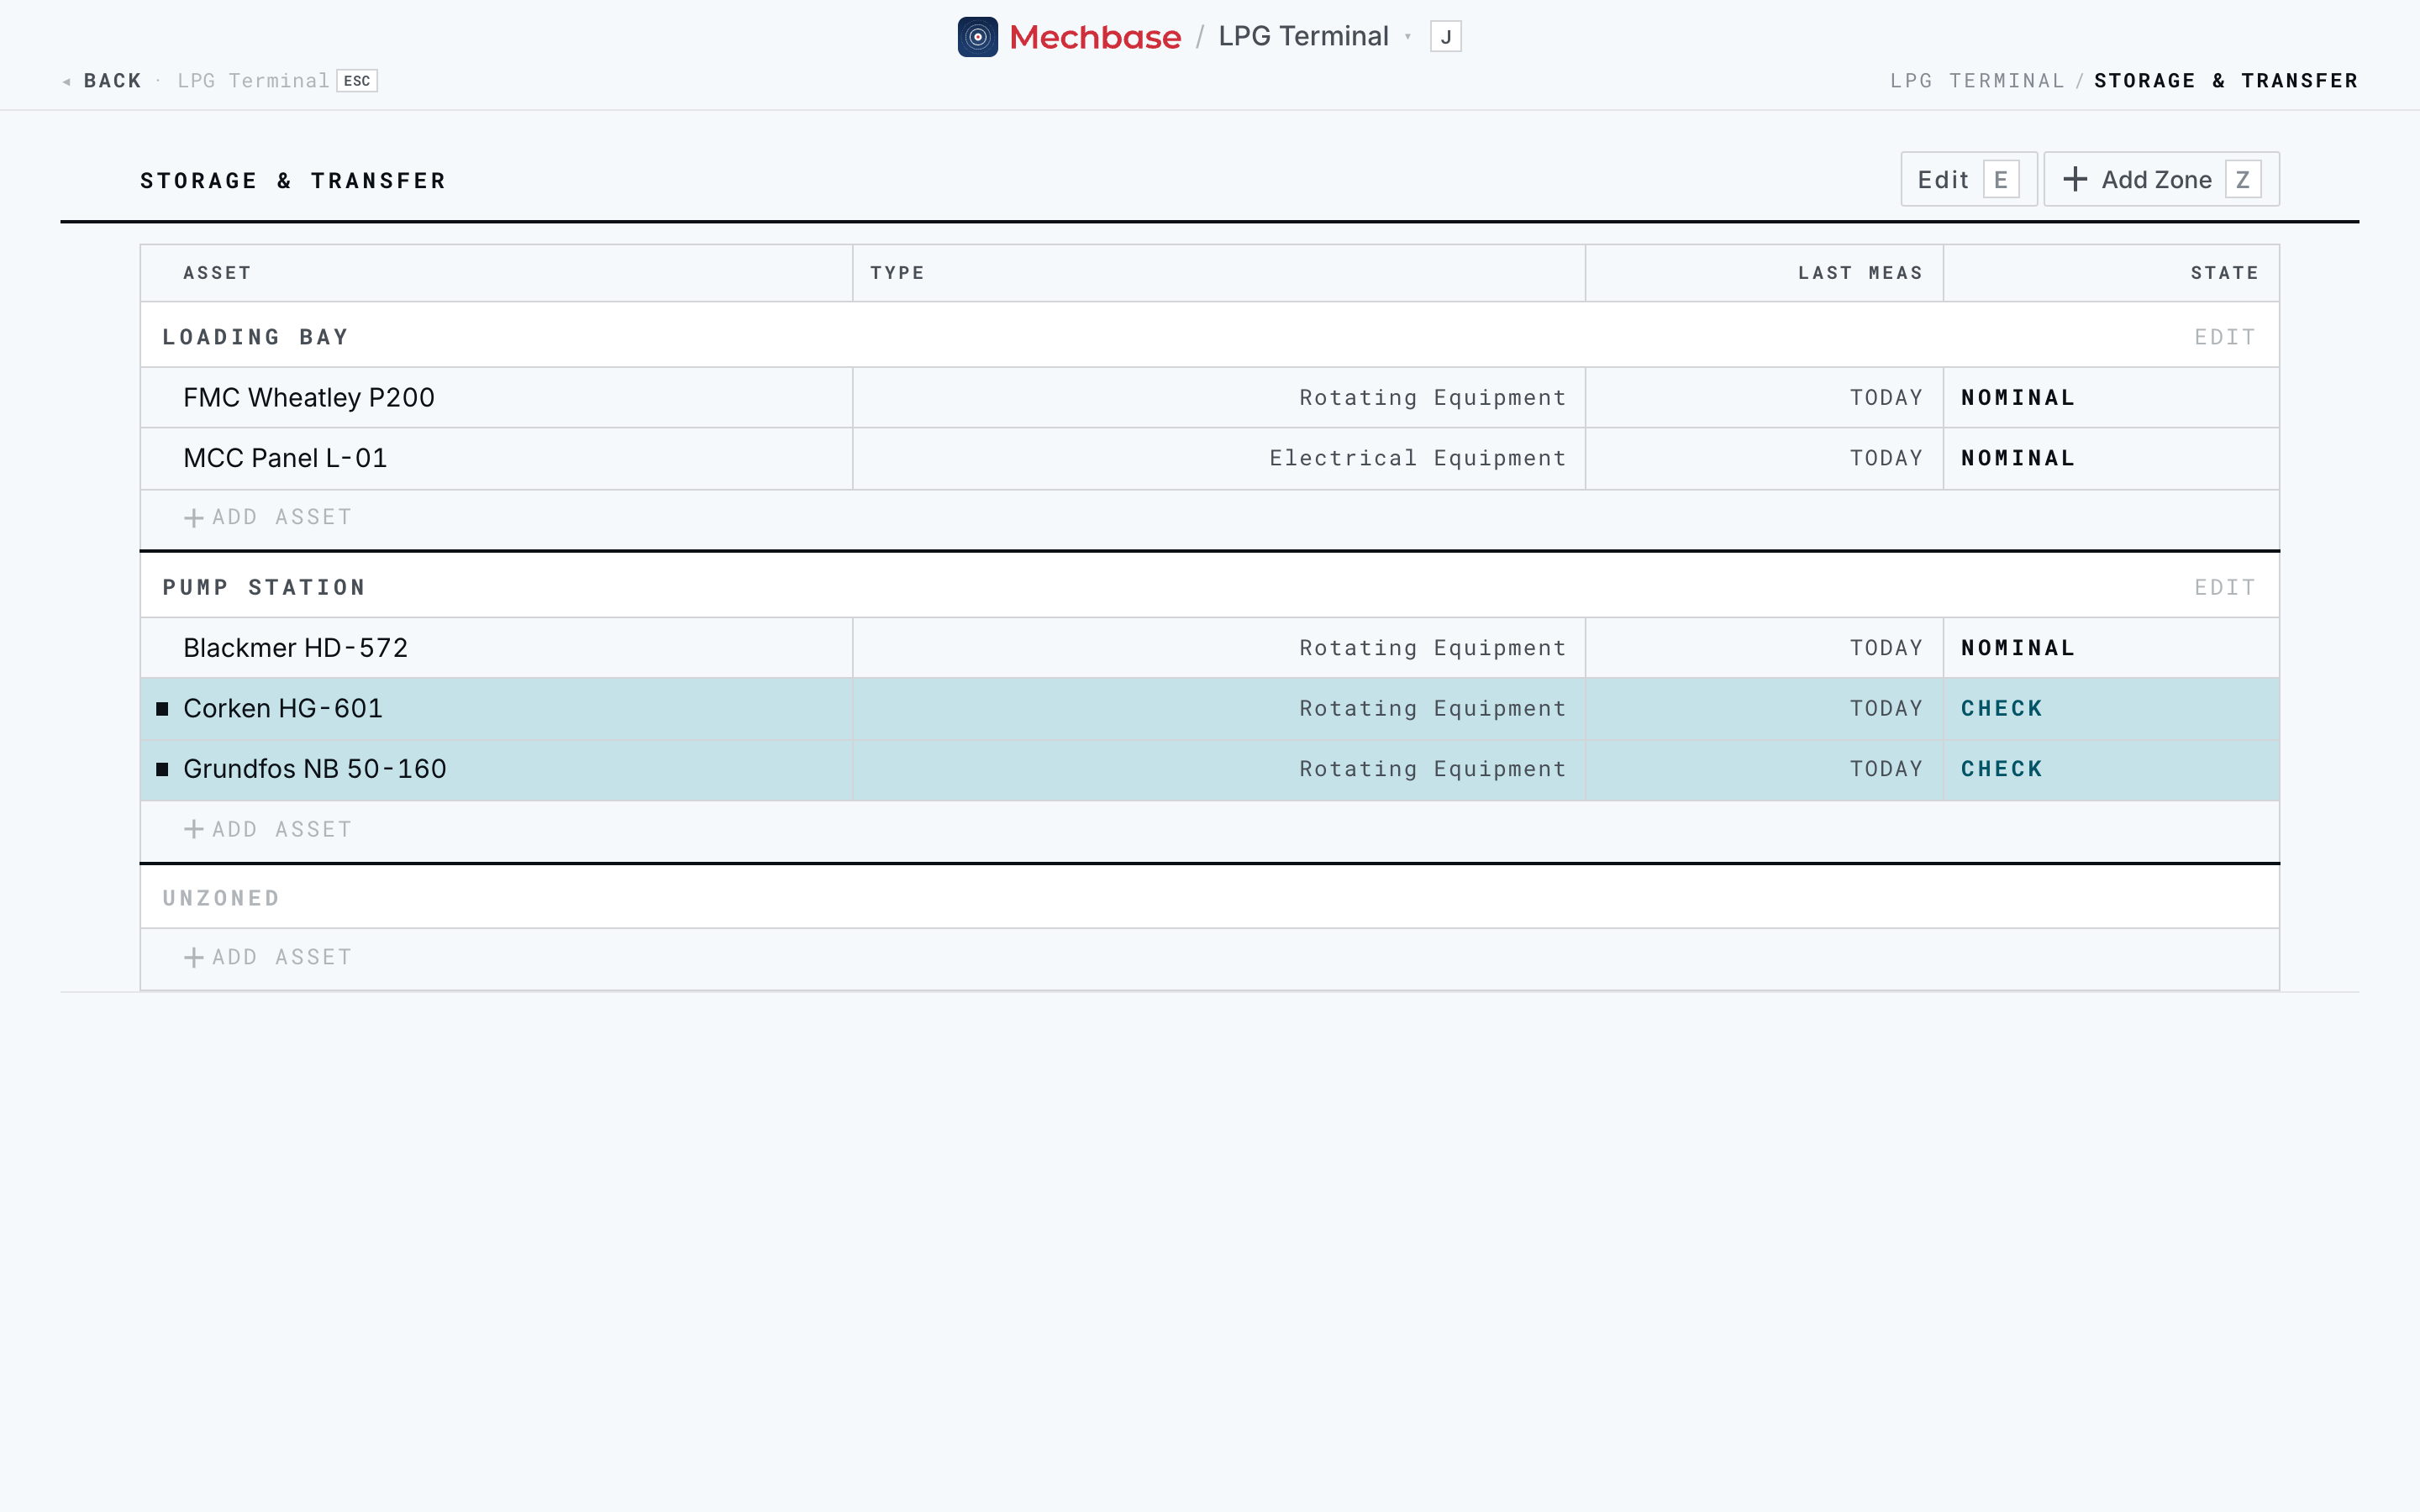
The section page is a single, scannable table of everything in the area, grouped by
zone. The header has Edit (E) to rename or delete the section, and Add
Zone (Z) to create a new zone — give it a name and you’re done.
Note: The Add Zone, Add asset, and Edit controls are part of normal navigation, and any member of the site can use them. This chapter is about reading the plant; Working with assets and Setting up and managing your account cover building it.
Zones and the equipment inside them#
Within a section, assets are grouped into zones — the specific place the
equipment sits, like Pump Station, Loading Bay, or Power House. Zones are why
a location anywhere in Mechbase reads as Section / Zone (for example Storage &
Transfer / Pump Station).
On the section page each zone is a labelled block with its own Edit button (rename or delete the zone), and each asset is one row:
Asset — the equipment name and model, e.g. Blackmer HD-572. Click the row to open the asset page (Working with assets).
Type — its class: Rotating Equipment, Electrical Equipment, Static Equipment, or Infrastructure.
Last meas — when it was last measured.
State — its current health.
Every zone ends with an Add asset row: type a name in the New asset dialog, click Add asset, and the new asset appears in place. Assets not yet assigned to a zone sit under Unzoned, always at the bottom.
The zone page#
Click a zone’s name to open its own page — the place for everything about that location rather than any one machine.
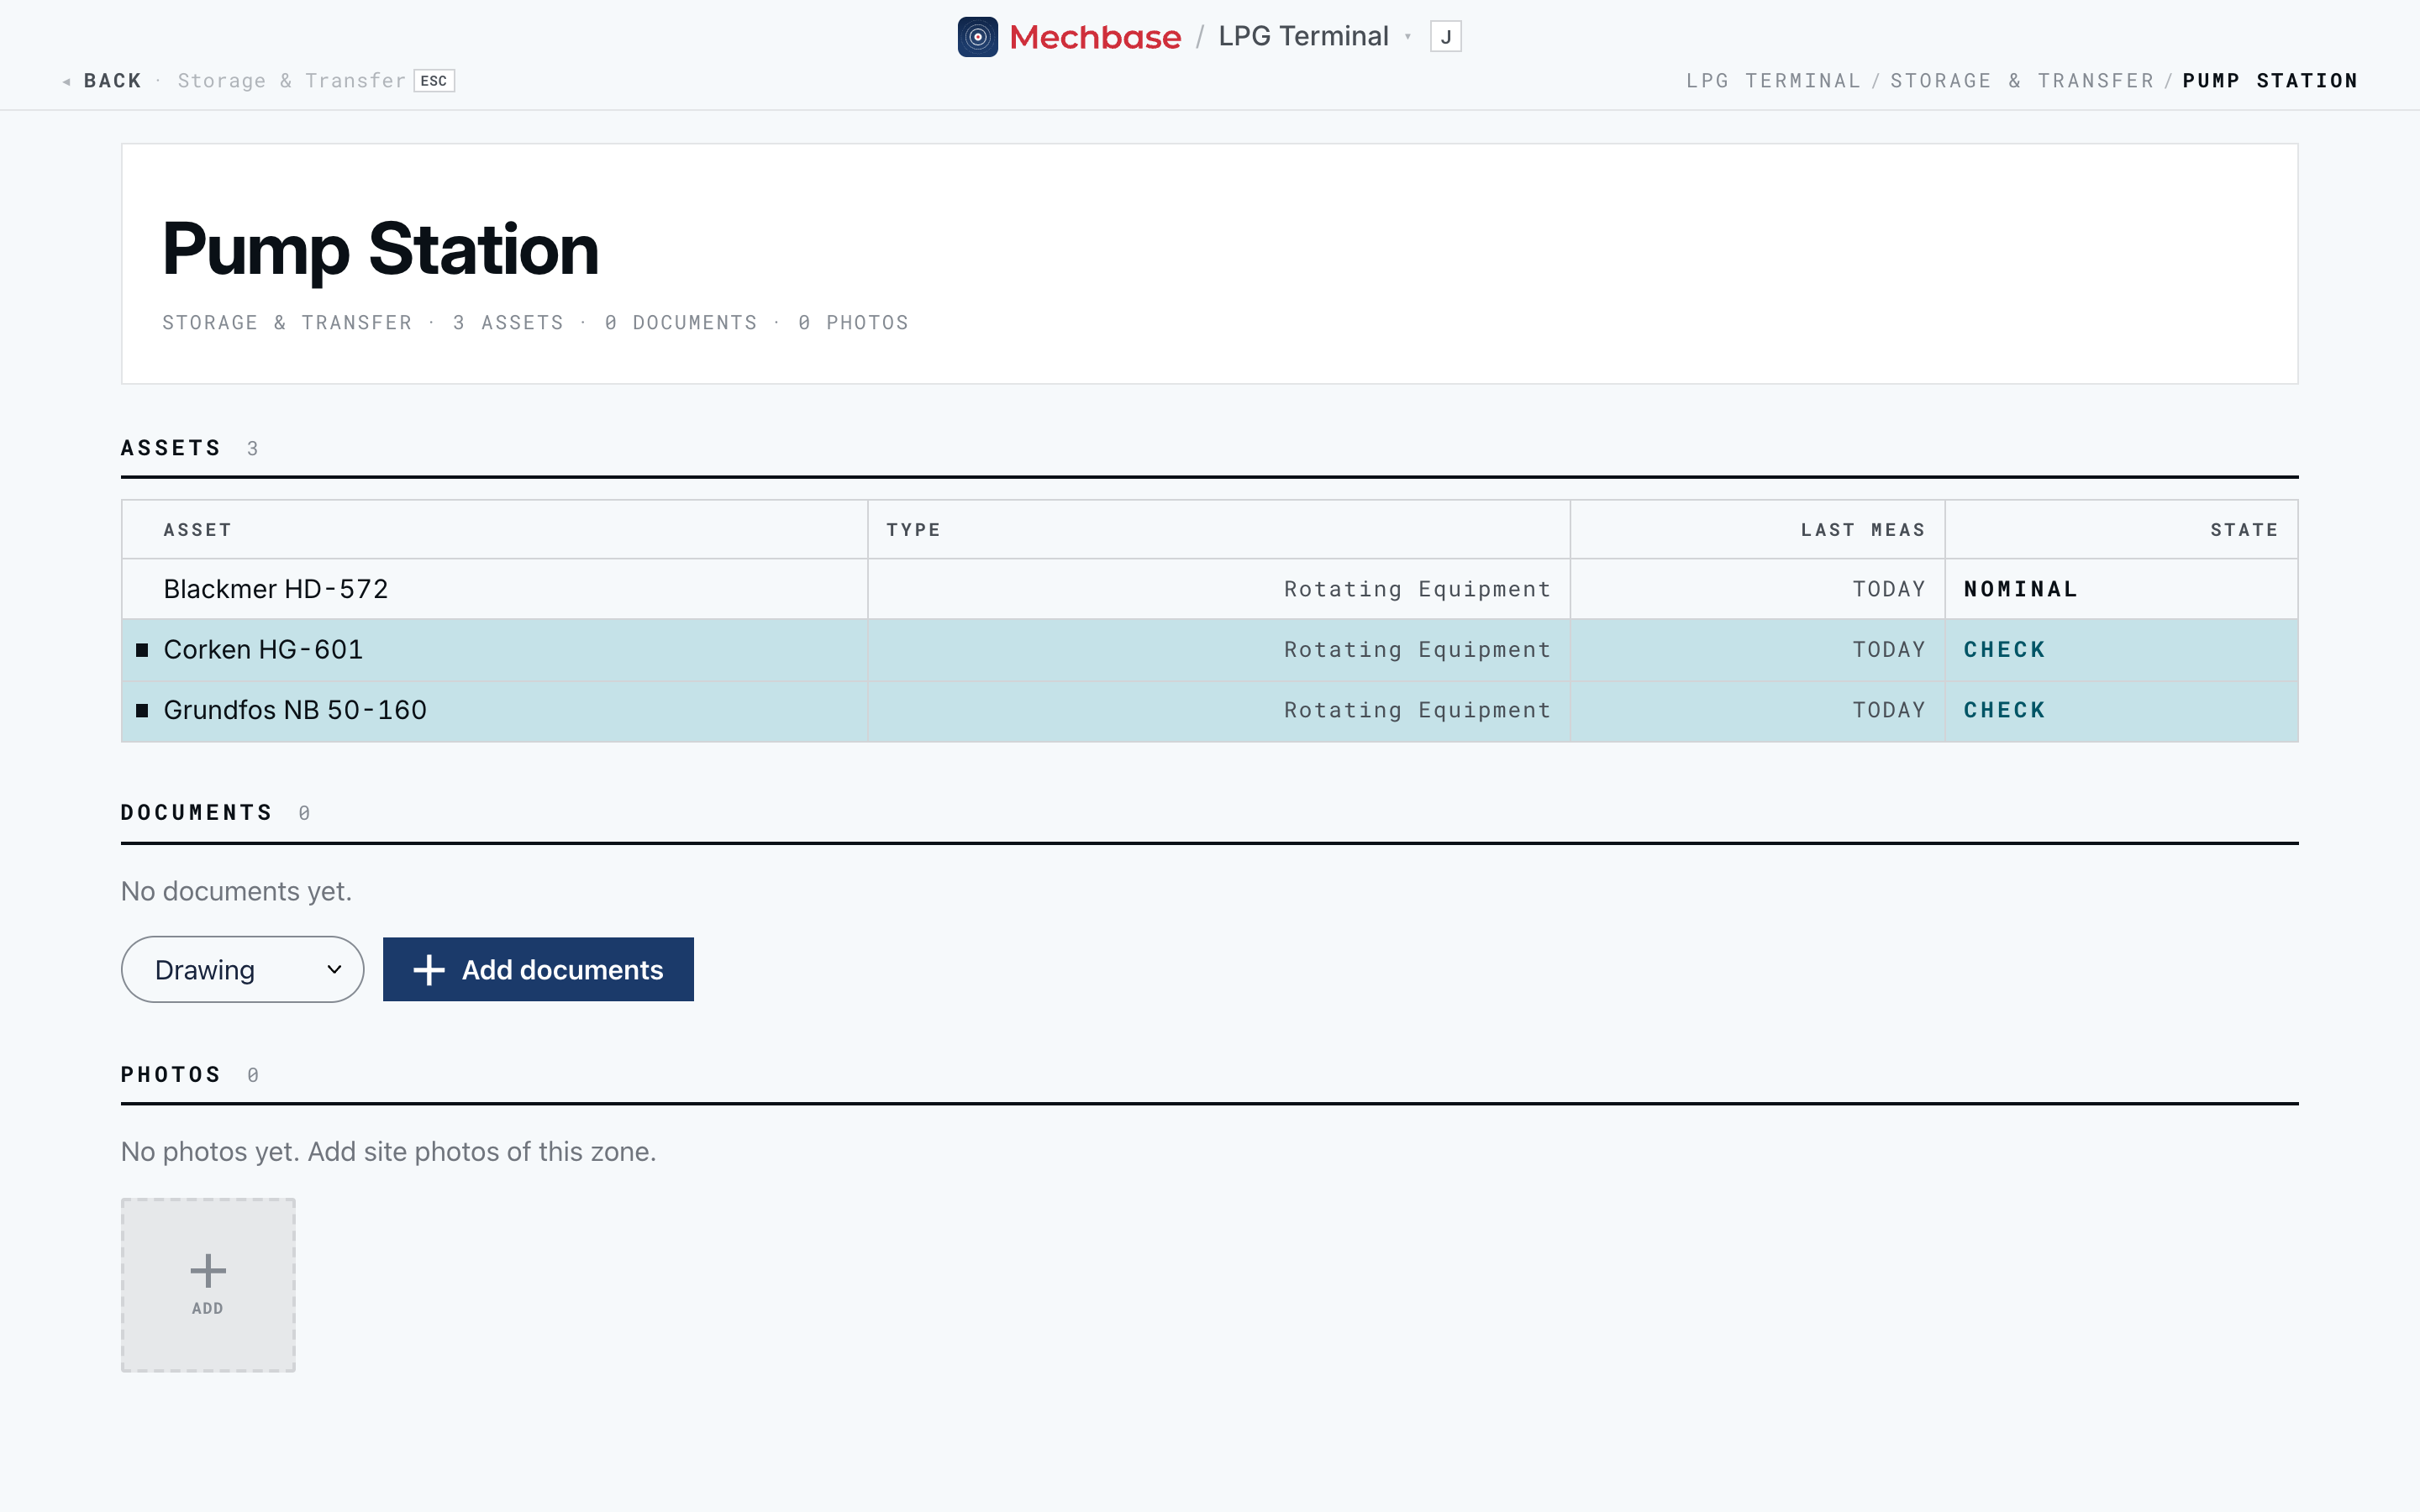
The header shows the section it belongs to and how many assets, documents, and photos it holds. Zones created by a room-list import also show their type and any old number they’re also known as (Setting up and managing your account).
Assets — the same rows as on the section page.
Documents — drawings, datasheets, manuals, check sheets, and test reports for this zone. Pick a kind and click Add documents to upload. Documents shared by every zone of the same type appear here too, marked with where they came from.
Photos — site photos of the zone, grouped by the day they were taken. Use the Add tile to upload.
Tip: The section page is the quickest “walk the area” view. It lists every asset in a zone with its latest state, so you can plan a physical round zone by zone.
What the colours mean#
Every asset is always in exactly one of four health states. The same four words and colours appear everywhere — the home page, section pages, asset pages, dashboards, the activity feed, and the field apps.
State |
Colour |
What it means |
What to do |
|---|---|---|---|
Nominal |
neutral |
Within normal limits; healthy. |
Nothing. |
Check |
teal |
Slightly off baseline — an early, soft signal. |
Keep an eye on it. |
Warning |
amber |
Clearly degraded. |
Plan an intervention. |
Critical |
red |
Severe. |
Act now. |
Mechbase never shows a state by colour alone. In lists, a Check, Warning, or Critical row is tinted and carries the state word; Warning and Critical rows also get a small ▸ flag in the margin so they stand out when you scan. State chips put a solid square (■) before the word. A hollow square (□) marks something Stale — data that hasn’t arrived recently, not a machine fault.
You never set states by hand. Mechbase derives them from measurements (Measurements, trends, and alarms) and inspections (Inspections and routes), and records every change. That’s what produces the plain-language history in the activity feed — “degraded to warning”, “improved to check”, “returned to nominal”. For a director, it means an asset’s health is a dated, auditable trajectory, not a snapshot opinion.
Needs attention: where to start each day#
The home page’s Needs attention panel is the most useful view for day-to-day work — every asset that isn’t healthy, most urgent first.
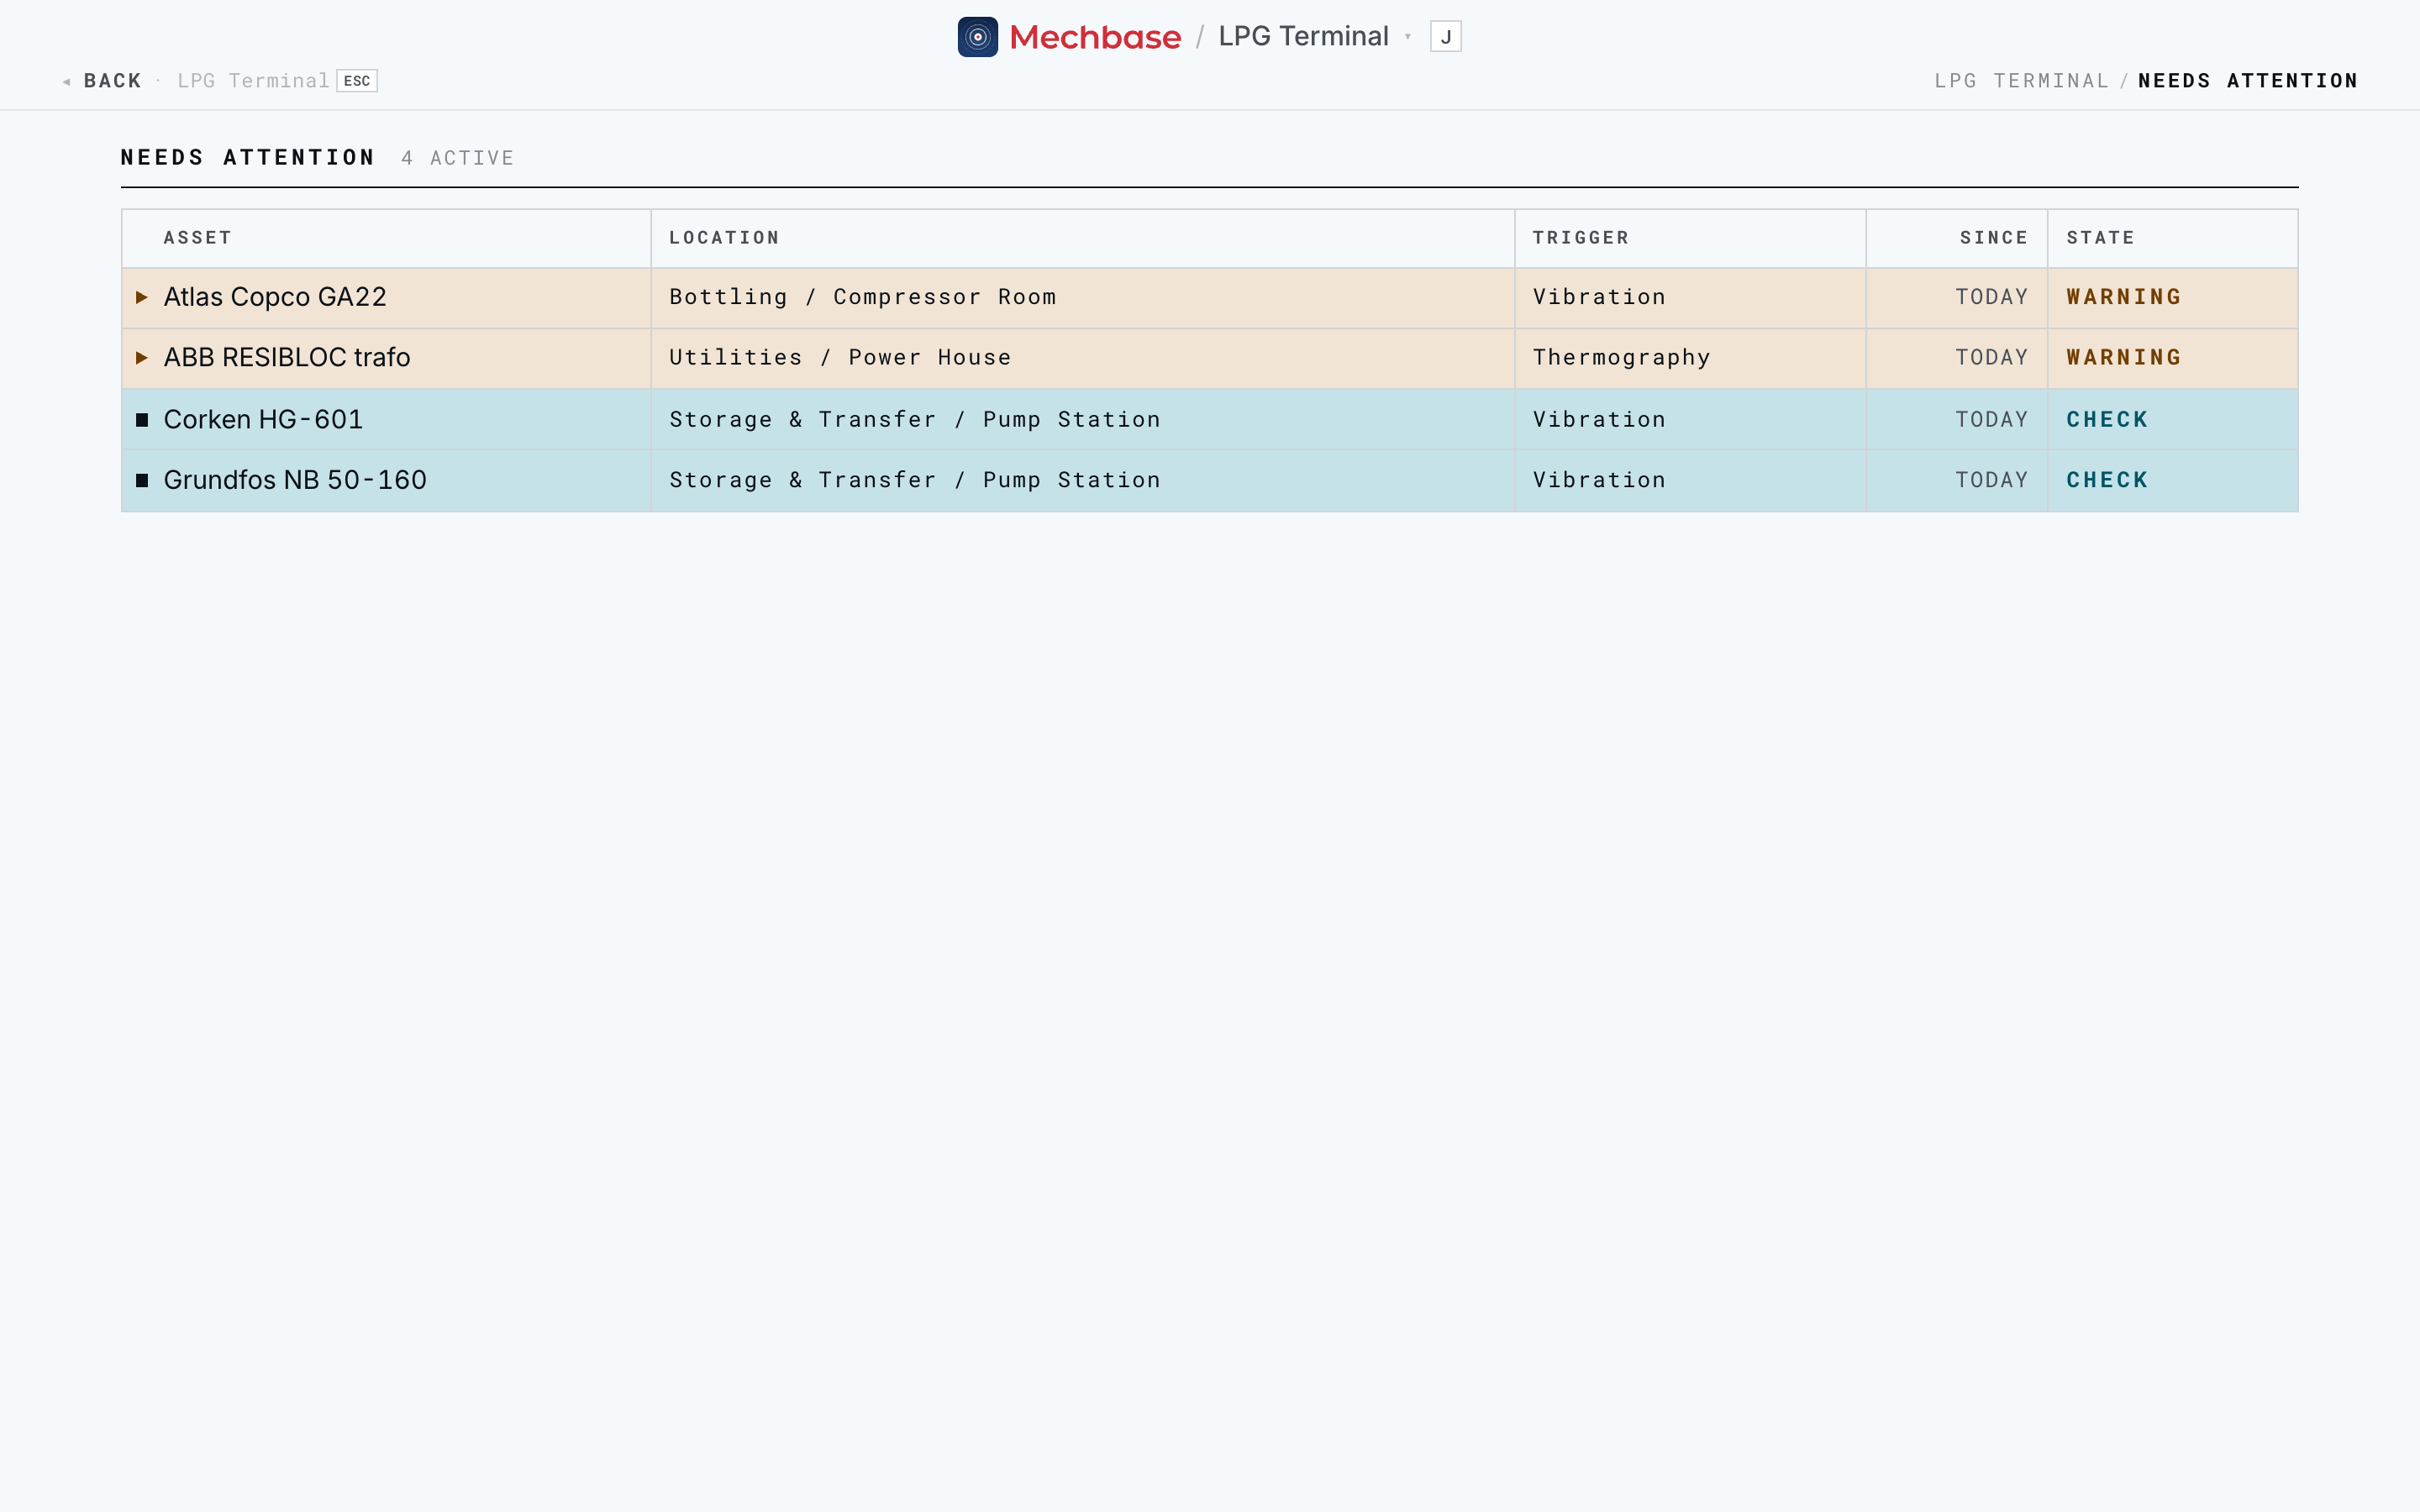
Read it left to right: the Asset, its Location (Section / Zone), the
Trigger that raised it — the measurement point or the inspection check
responsible — how long it’s been in that state (Since), and the State
itself. Click any row to go straight to the asset and act.
When more need attention than fit, +N more opens the full list — also on the
menu as Needs attention (3). That screen and the triage workflow around it are
Staying on top of what needs attention.
Recent activity: your audit trail#
Where Needs attention answers “what’s wrong now?”, Recent activity answers “what’s happened, and who did what?”. It’s the site’s log, newest first, at the bottom of the home page.
Four kinds of entries are mixed together:
Measurement — automatic state changes from readings, e.g. “Atlas Copco GA22 degraded to warning”, or “2 assets degraded to check” when several change together.
Inspection — completed routes, e.g. “Demo User completed route — 1 non-conformity”, linking to the run report.
Note — comments people left on an asset.
Finding — an analyst’s diagnosis recorded on a reading.
Because every state change, inspection, and note lands here with a date and a name, the feed is a ready-made audit trail. A director can answer “was this asset inspected last month, and how has it trended since?” without leaving the home page, then click straight through to the evidence.
Every point on one page#
Points (menu, or press 5) lists every measurement point on the site in one
table — the fastest way to scan all your readings at once, or to compare like with
like across machines.
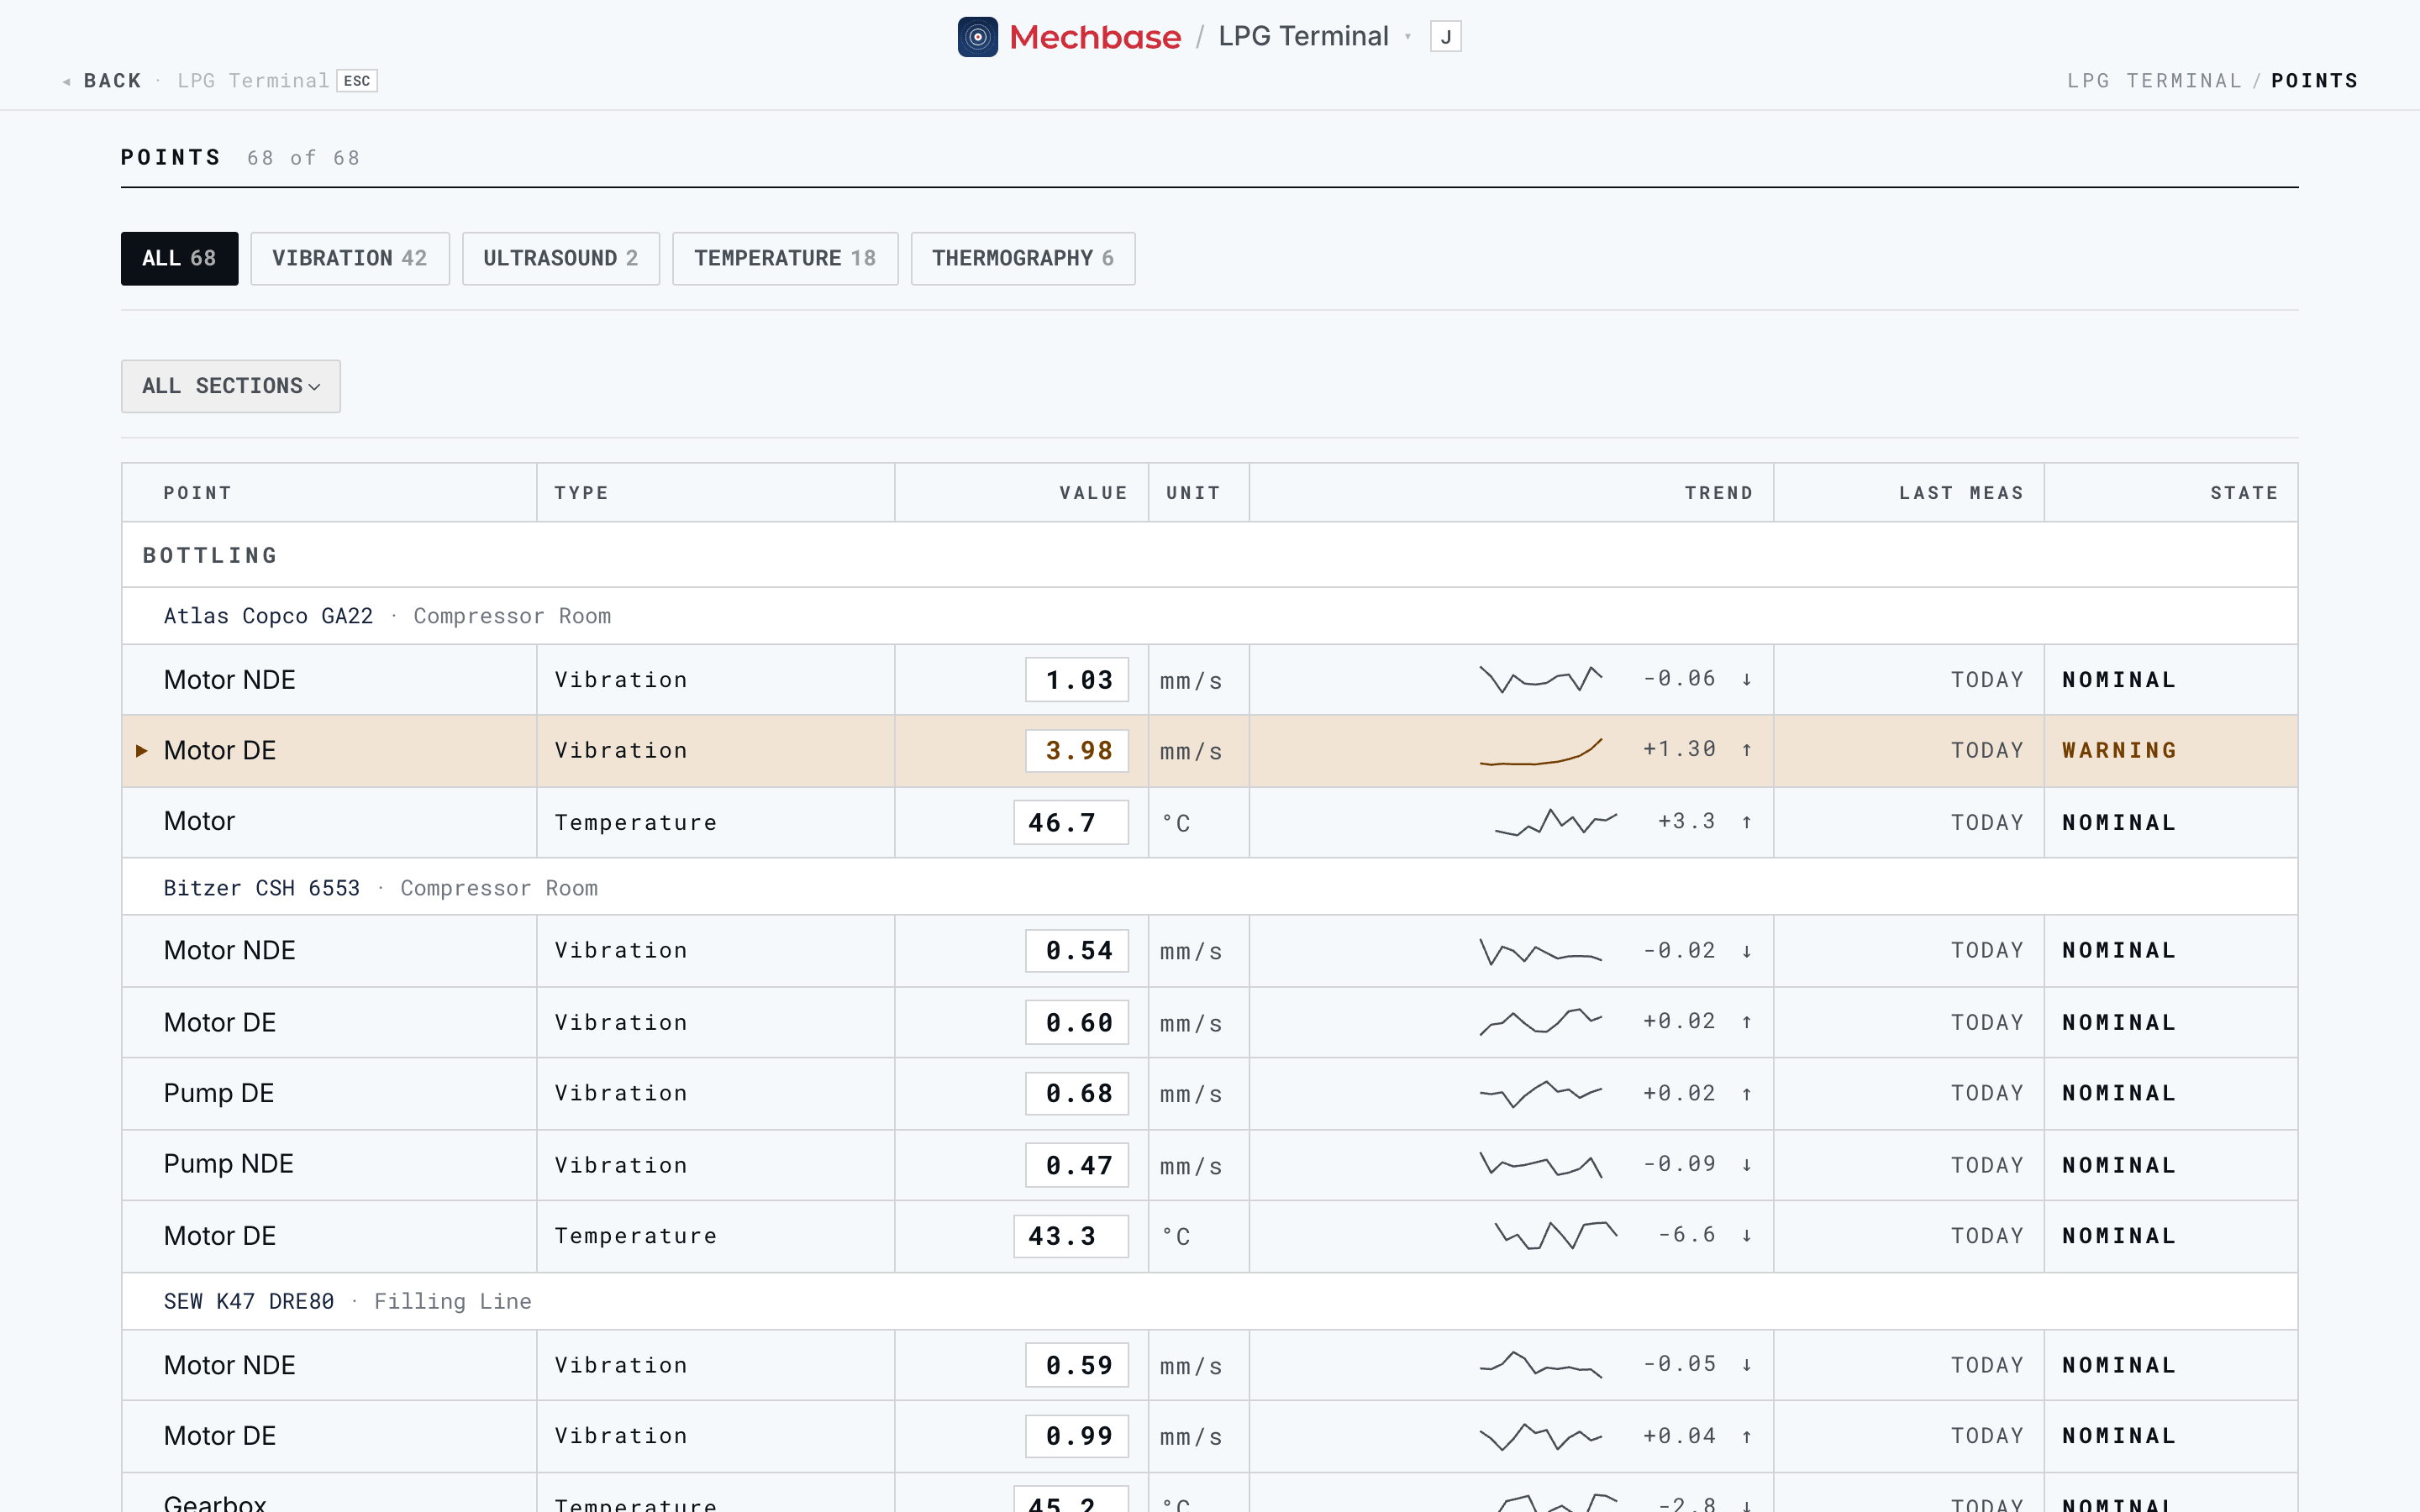
Points are grouped by section, then by asset (with its zone). For each you see the point’s location, its Type, the latest Value and Unit (in your units), a small Trend line with the recent change (↑ / ↓), when it was Last meas, and its State.
Two filters sit above the table:
Type pills — All, or just Vibration, Temperature, Ultrasound, Thermography, and so on, each with a count.
Section picker — All sections, or one section only.
Click any point to open it. Running-hours (production) points aren’t listed here — they have their own page, next.
Running hours#
Mechbase keeps track of when each machine is running, and Hours (menu, or press
4) totals it up for every asset that tracks running time.
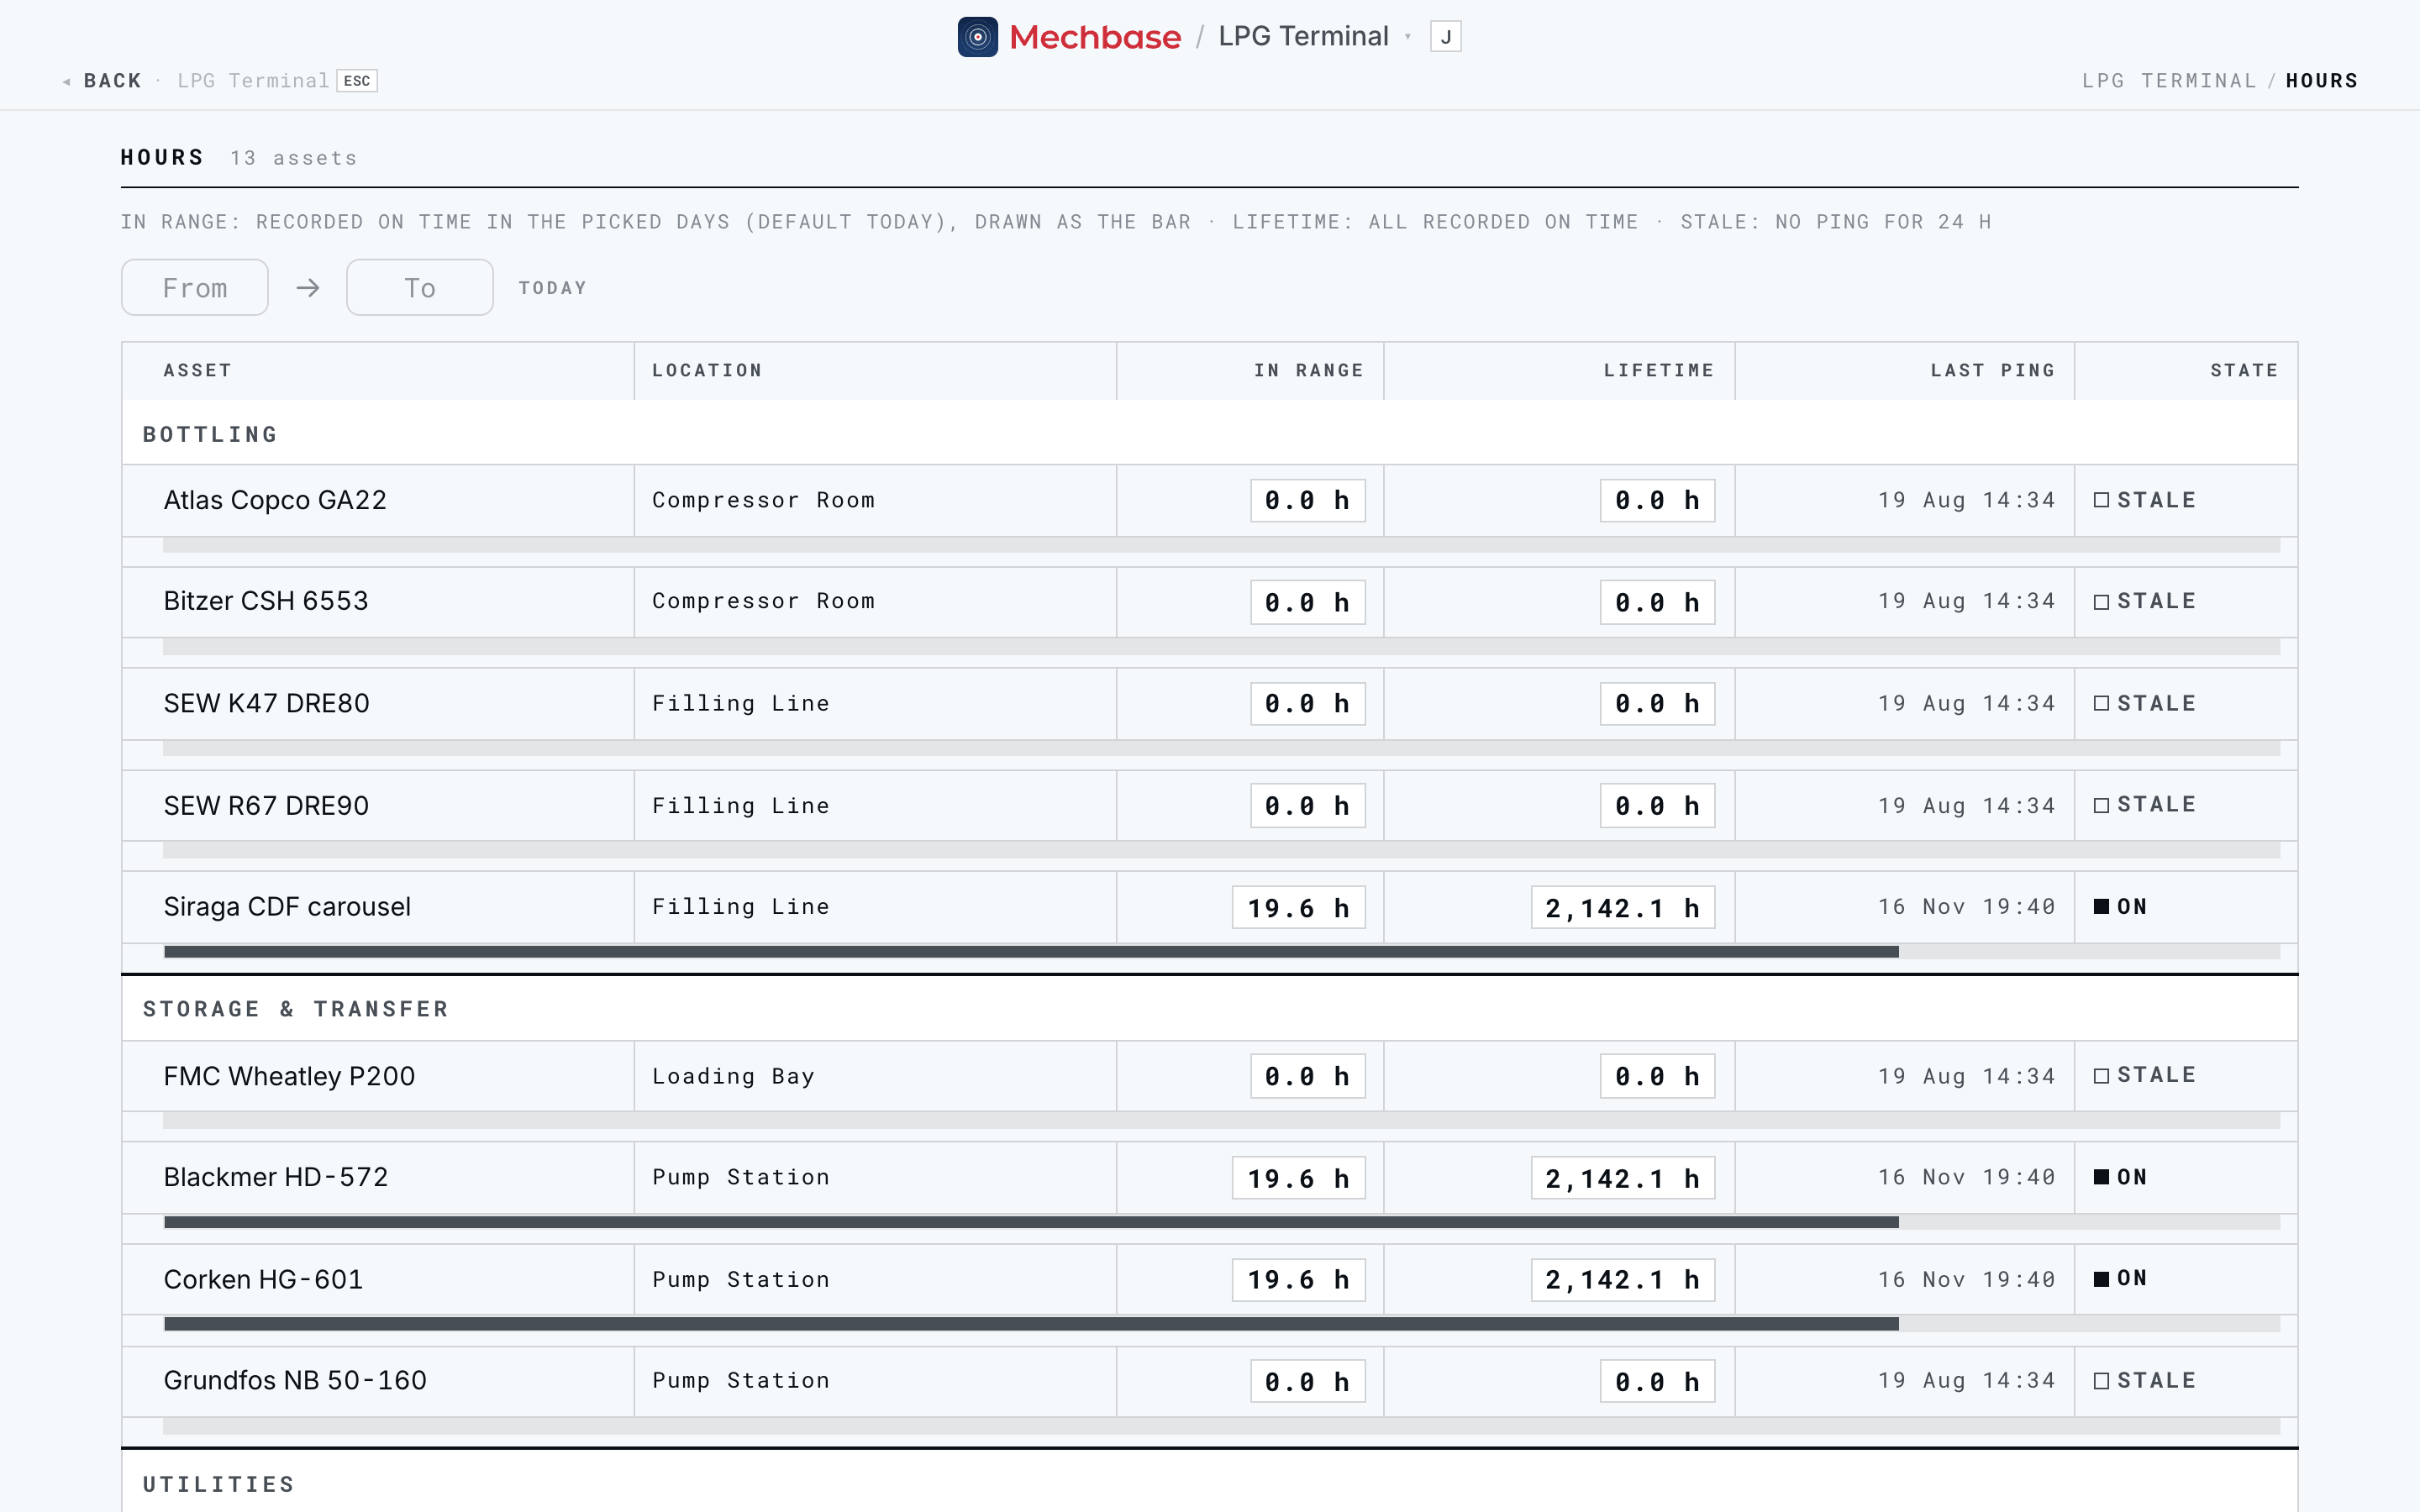
Assets are grouped by section. For each you see:
In range — running time recorded in the days you pick (today by default), also drawn as the bar under the row.
Lifetime — all running time ever recorded.
Last ping — when the running signal last reported.
State — On, Off, or Stale (no signal for 24 hours). These aren’t alarms, so they’re shown in ink rather than colour.
Use the From → To pickers to total a week, a month, or a maintenance interval. How Mechbase knows a machine is running — a tachometer, a run signal, or the vibration itself — is explained in Working with assets.
Dashboards: a live board of what you watch#
A dashboard is a live board of the measurement points you choose, grouped into
sections — built for a control-room screen, a supervisor’s second monitor, or a
quick glance at a group of machines. Open it from Dashboards in the menu, or
press 6.
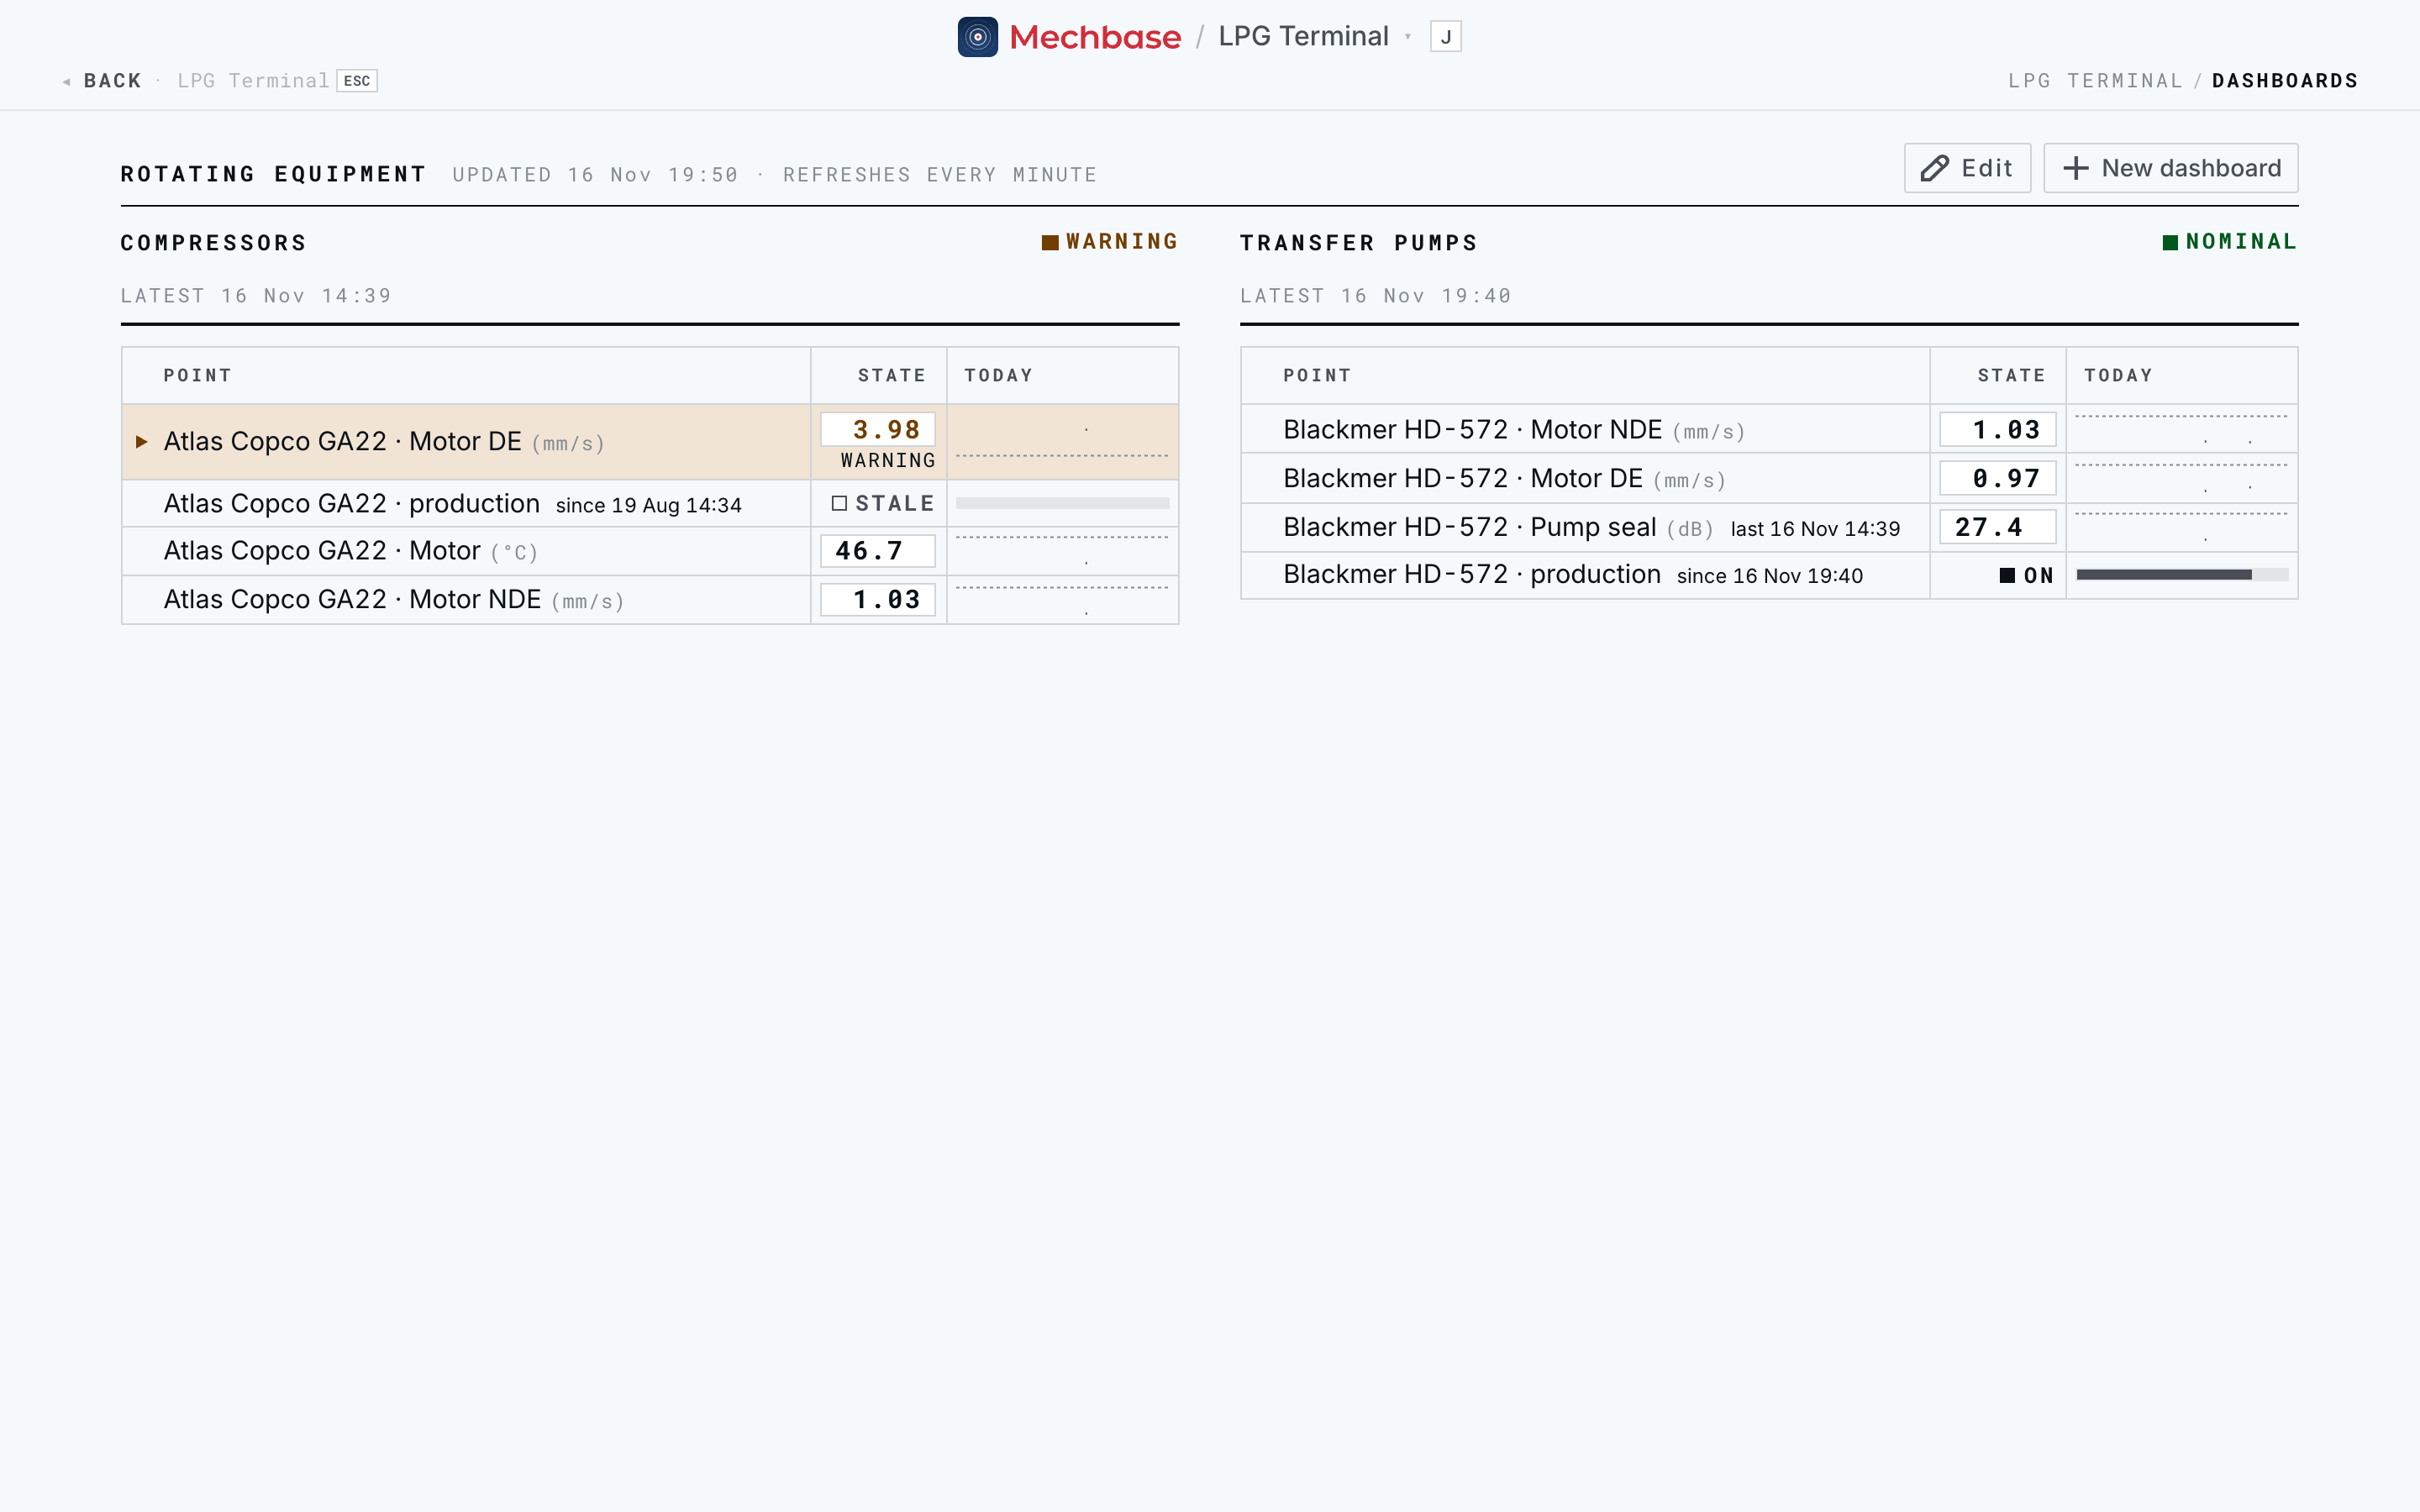
Each section of the board shows its title, when it last received data, and a status chip (the worst alarm in the section, or Nominal). Inside, each point is one compact row:
Point — the label (asset and location by default) and the unit. “since …” tells you when an on/off state started; “last …” flags a point that’s fallen an hour or more behind the rest of the section.
State — the current value. In a section with an alarm, the alarm word sits beside the value. On/off points show On / Off; a feed that’s gone quiet shows Stale.
Today — today’s trend across a fixed midnight-to-midnight axis, with the warning limit drawn as a dashed line. On/off points show a strip of their periods instead.
Only rows in Warning or Critical are tinted, so a calm board stays calm and an alarm stands out from across the room. The board refreshes itself every minute (Updated … · Refreshes every minute), and on a wide screen the sections flow into columns so a whole area fits on one screen. On a phone, a list of Sections in alarm appears at the top.
If a site has several boards, the board name becomes a switcher; the default board is the one that opens from the menu. Before anyone has built a board, Mechbase shows an automatic one — All monitored points — with a section per asset that has live MaintNode sensors.
Building a board#
Building and editing boards is a staff task. On the board, click New dashboard (or Edit on an existing one).
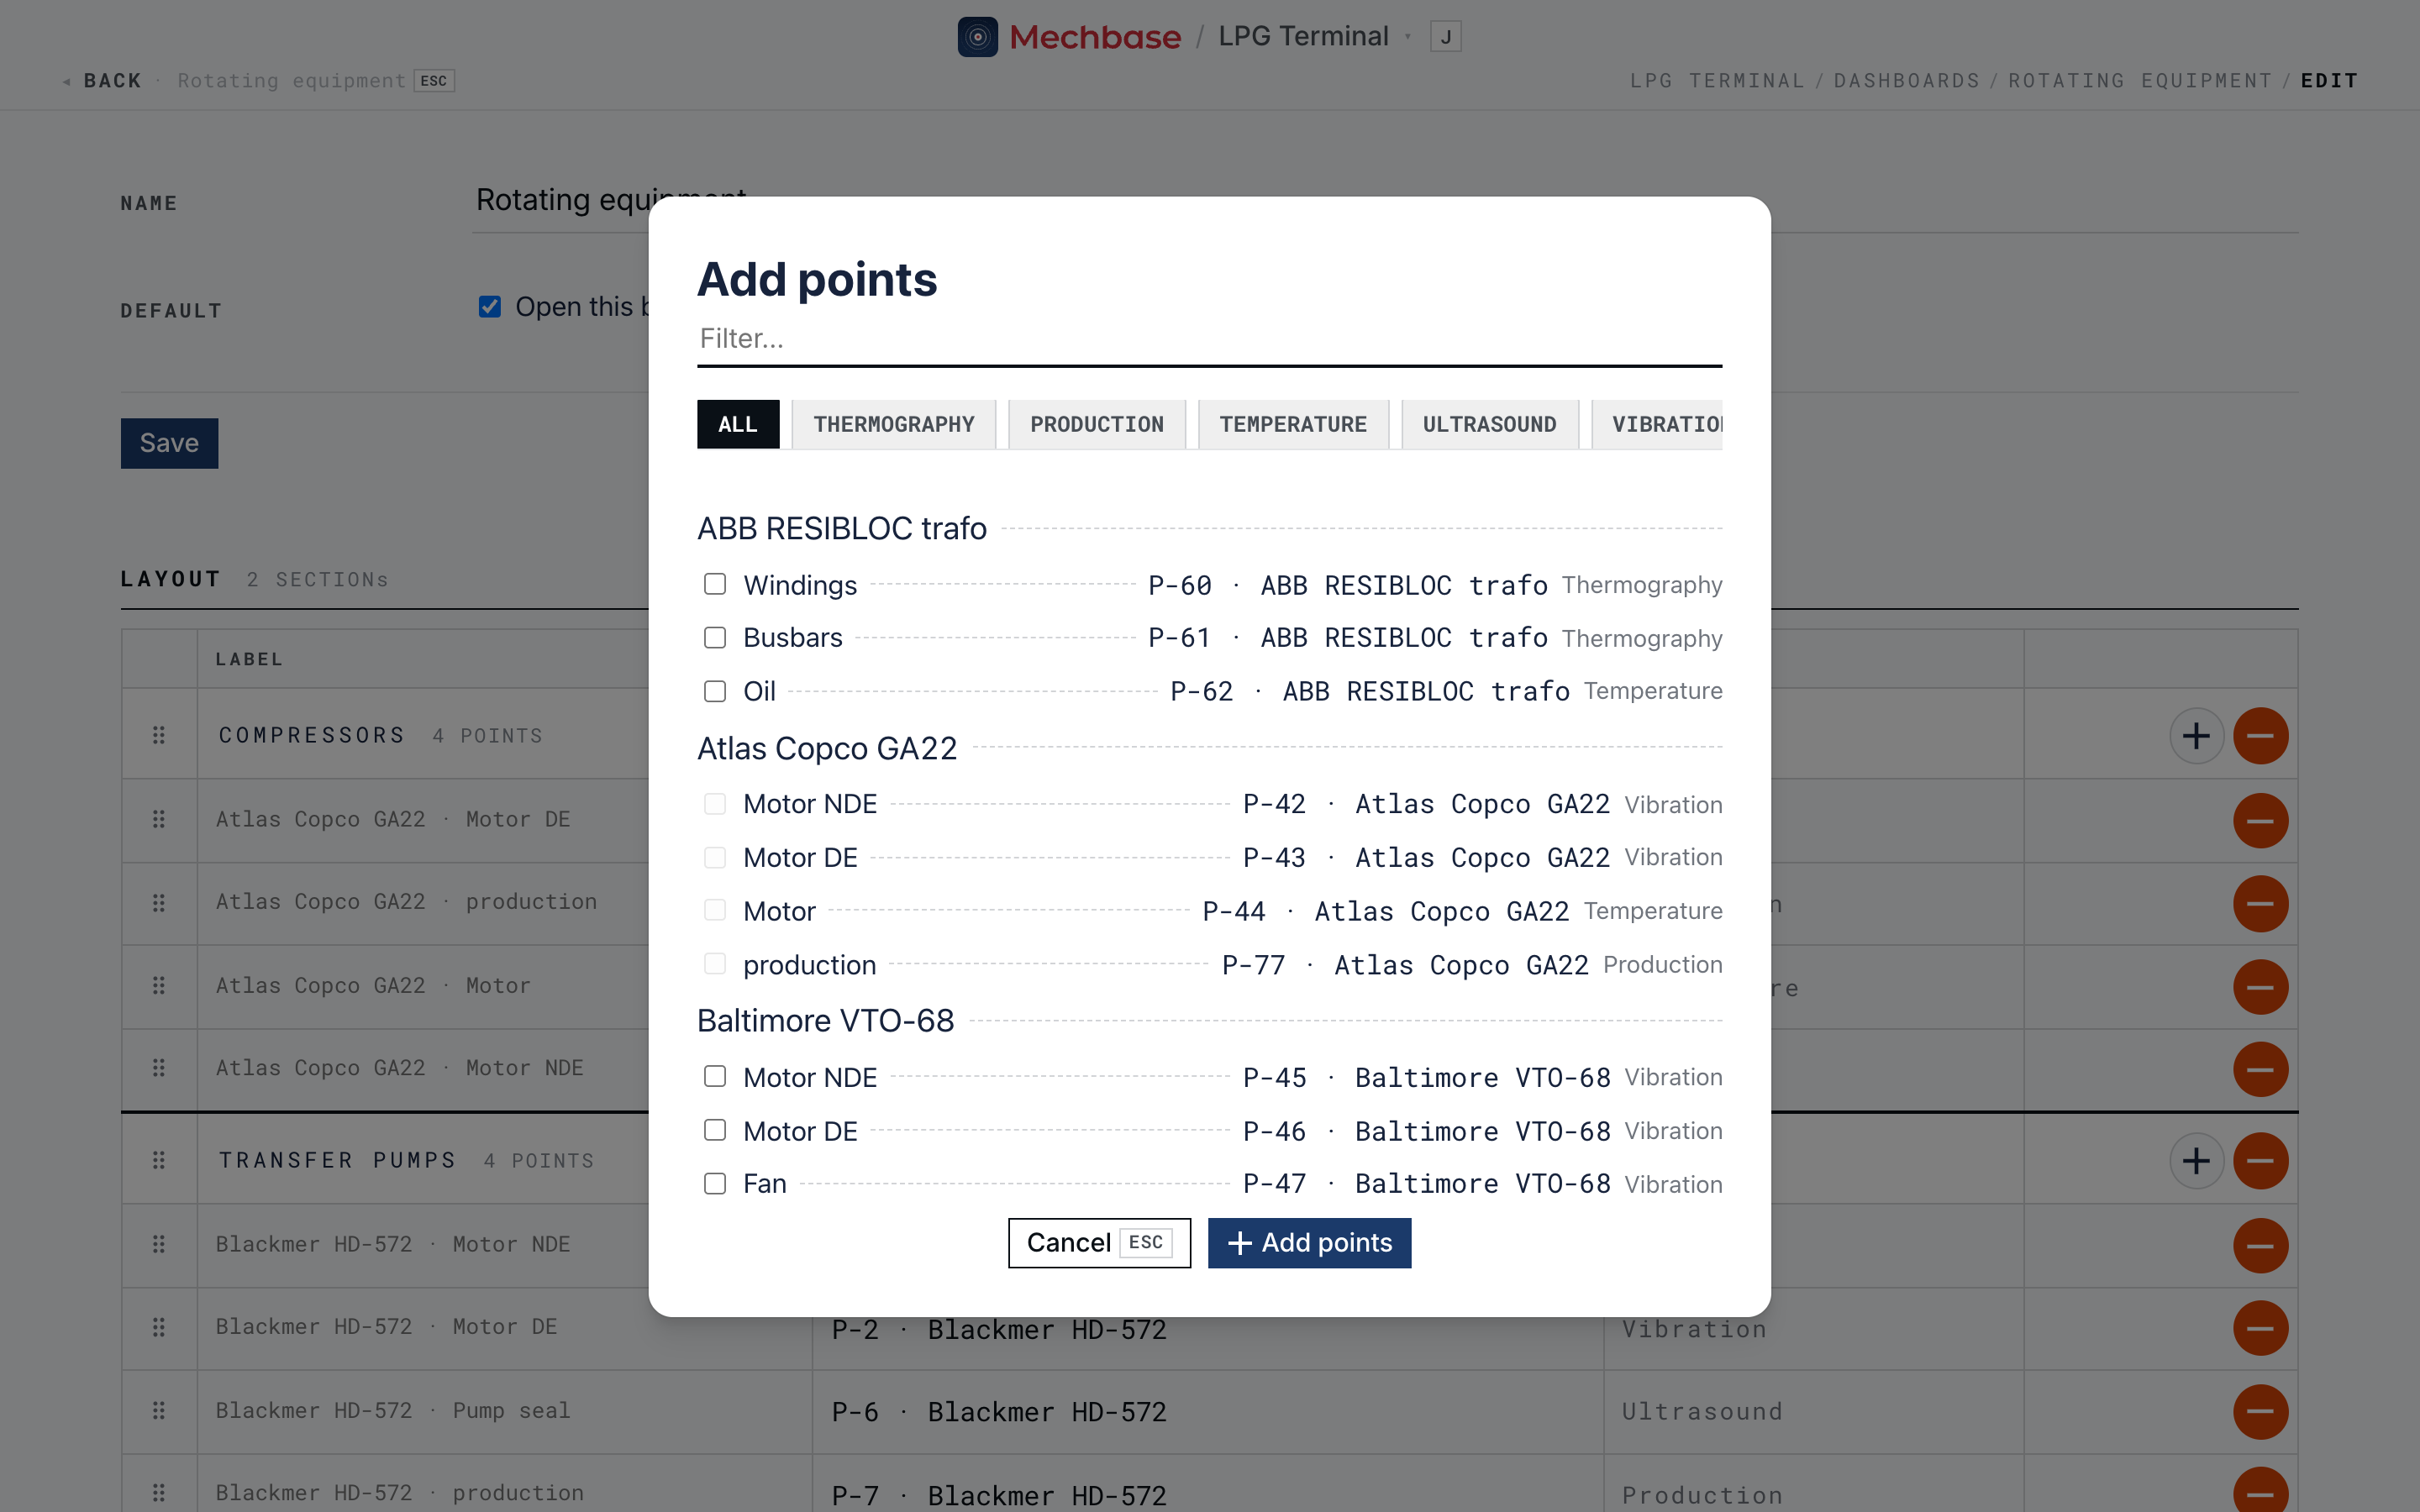
Give the board a Name, and tick Default if it should open from the Dashboards menu. Click Save.
Type a Section title and click Add section.
Click + on a section to open Add points. Filter by name or type, tick the points you want, and click Add points.
Drag the handles to reorder sections and points — or move a point to another section. Every drop saves on its own.
Rename a section or give a point a shorter Label by typing over it.
Use – to remove a point or a section, and Delete board… to remove the whole board. Removing things from a board never touches the points or their readings.
Tip: Build one board per audience — a control room wants every critical machine on one screen; a pump-station supervisor wants just their area. Short labels (“GA22 DE”) read better on a wall screen than the full default.