6 · Staying on top of what needs attention#
Mechbase gathers every asset that’s no longer healthy — whether a sensor flagged it or an inspector did — onto one Needs attention screen, so you can work through problems by priority, watch them clear as you fix them, and have the important ones reach you by email when you’re not looking.
The Needs attention list#
The home page’s Needs attention panel shows the top six items; the full list
lives on its own page. Open it from the +N more link on the panel, from
Needs attention in the menu (its badge shows how many are active), or by
pressing 3.
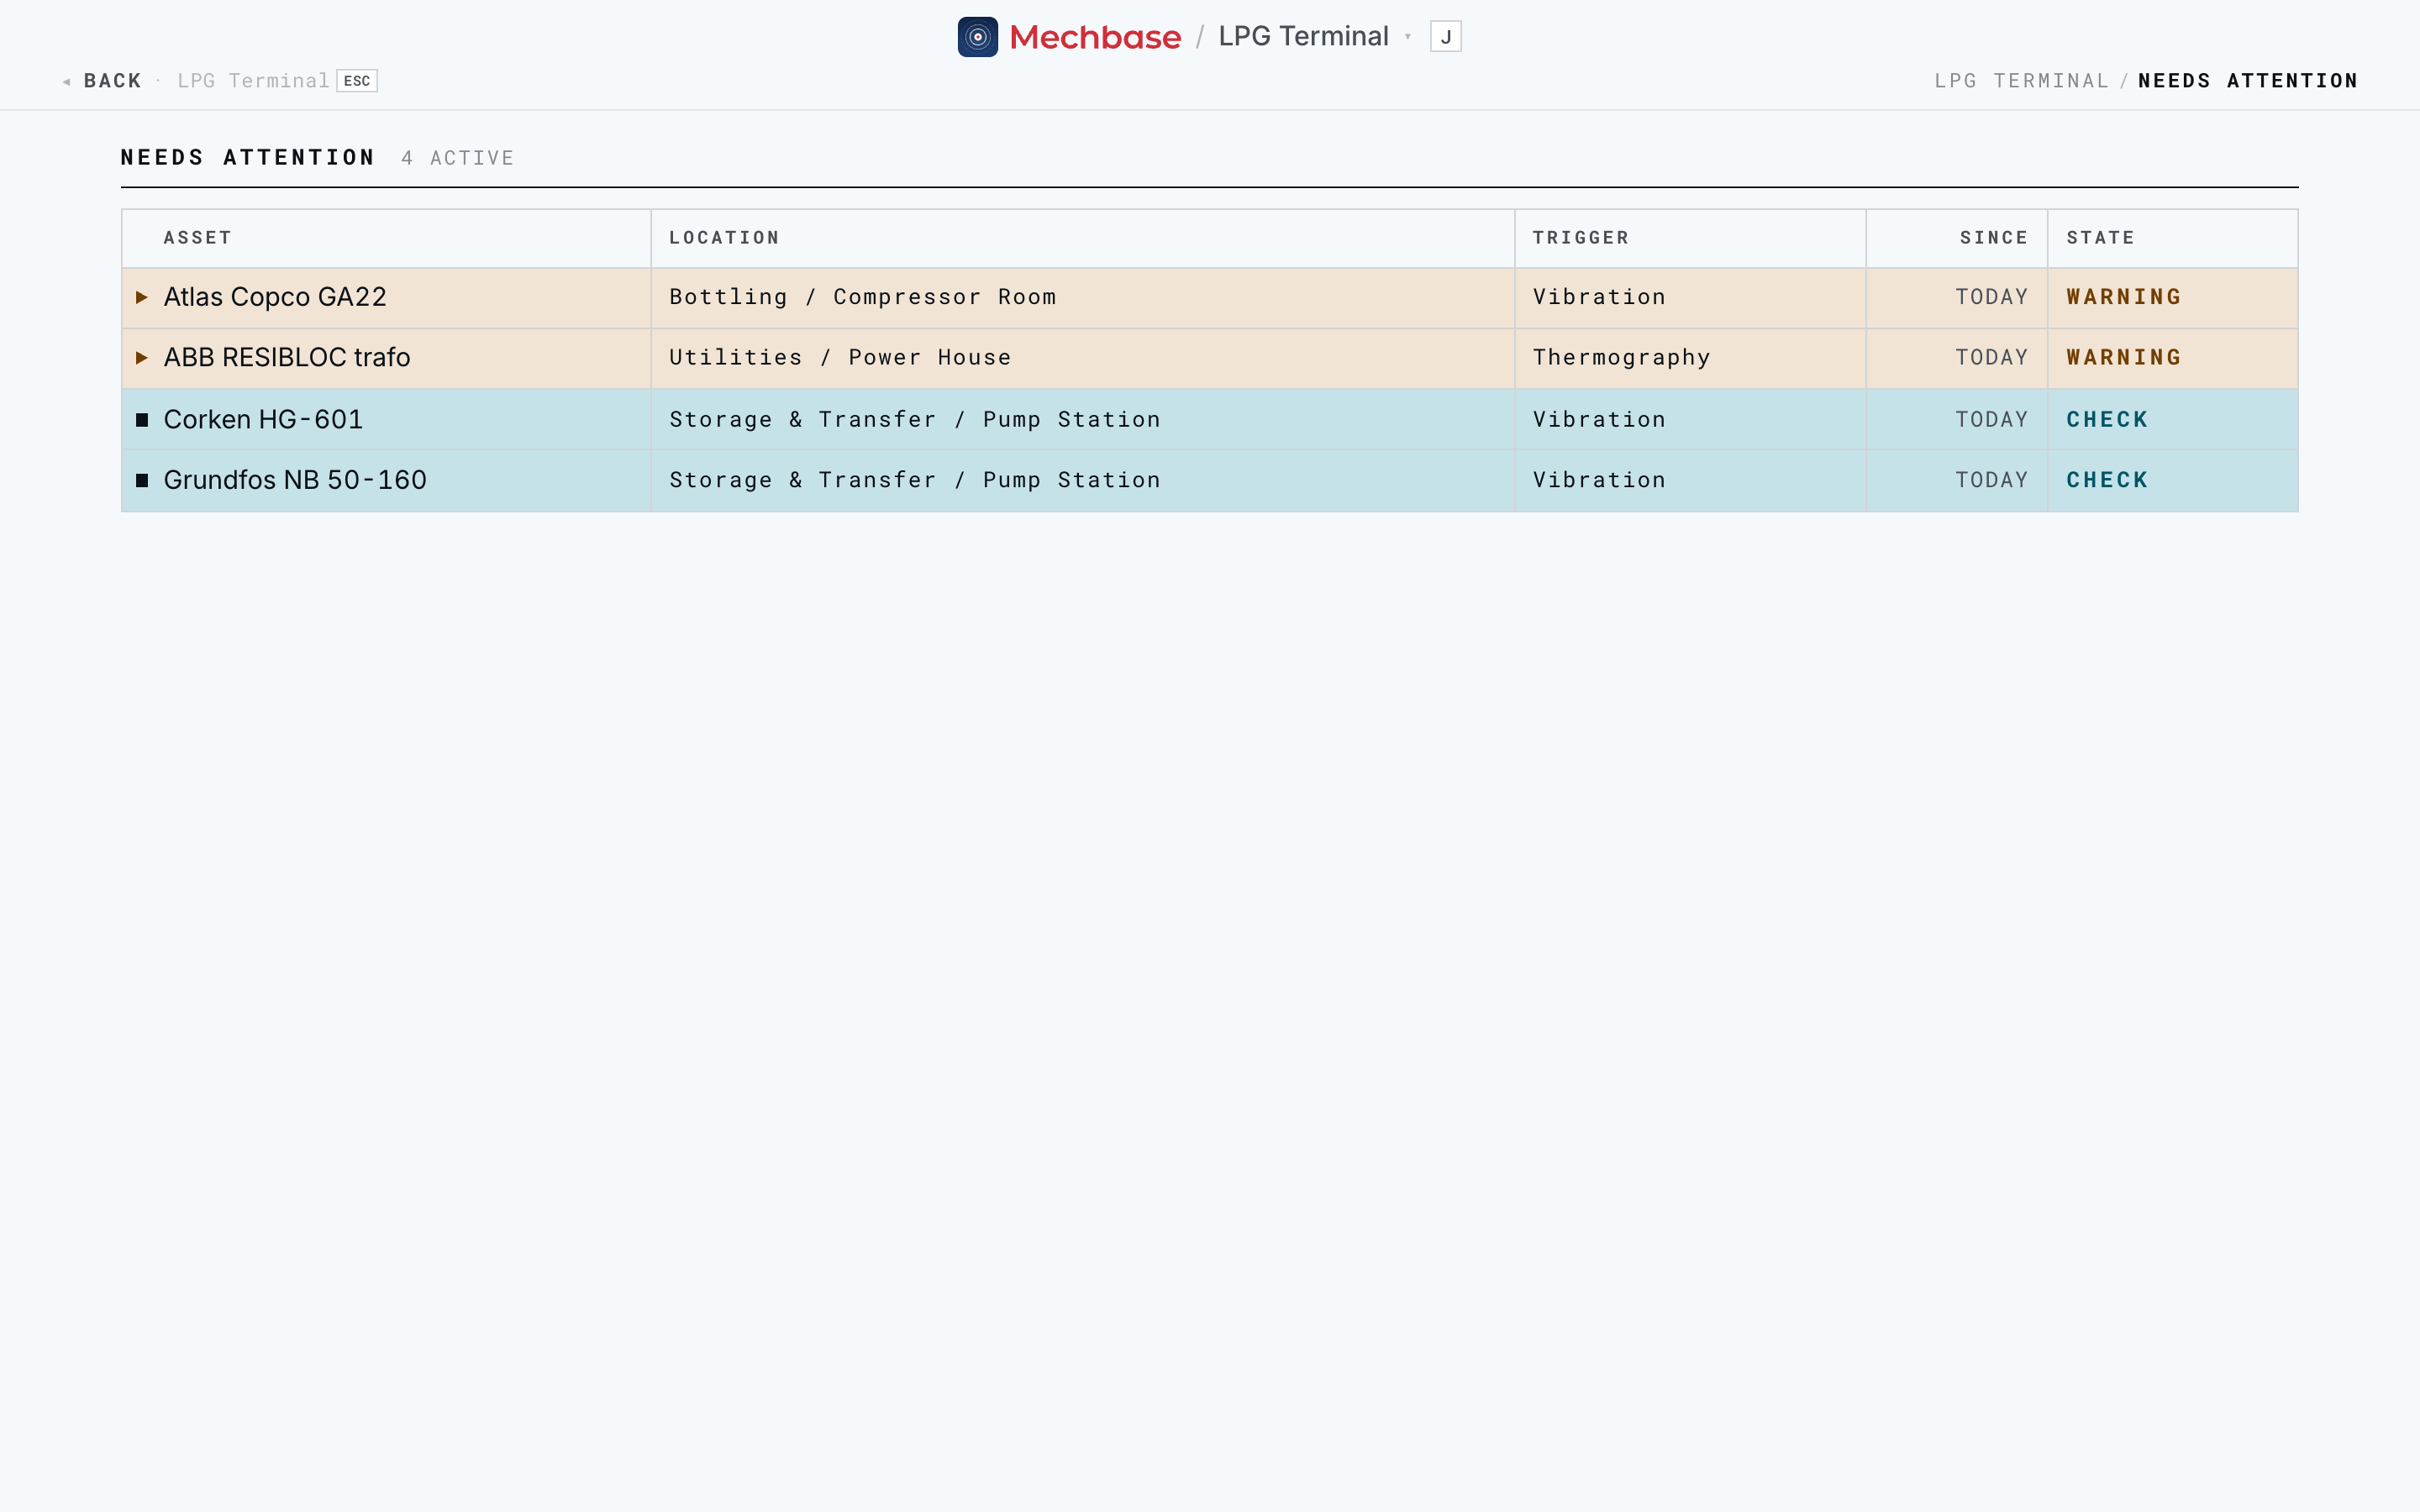
It’s every asset at the site that isn’t currently Nominal, ordered most urgent first — Critical, then Warning, then Check, and within each by section and name:
Asset — what it is; click the row to act.
Location —
Section / Zone.Trigger — what raised it: the measurement point that’s off (Motor DE), or the inspection check that failed (Oil level and quality) — whichever is worse.
Since — how long it’s been in this state.
State — Check, Warning, or Critical.
This is your single, current backlog of asset health. If nothing needs attention, the page says “All assets are nominal.”
Silent assets#
A sensor that stops reporting is a problem of its own — the machine might be fine, or it might be failing unseen. So after the health alerts, the list shows Silent assets: ones whose points used to report but haven’t sent a reading in 30 days, or whose live MaintNode feed has stopped. Their trigger reads “No reading: …” with the points concerned, and the home page heading counts them separately (“4 active · 1 silent”).
Treat a silent asset as a job too: check the sensor and its device, or the route that should have measured it.
Working through them#
Use the list the way it’s sorted — from the top:
Start with Critical, then Warning. The order already puts the most urgent first, so working top-down is working by priority.
Read the trigger to know what kind of problem it is — a vibration point, a temperature, a failed inspection check.
Click the asset to open it. There you get the full picture from Working with assets, Measurements, trends, and alarms, and Inspections and routes: the points that are off (the Points section counts them in alarm), their week of trend, the Activity history with its fault record links, and any open non-conformities pinned at the top.
Act, and let the evidence close it (next section). Leave a note on the asset so the next person knows what’s been done.
Tip: Check items aren’t urgent, but don’t ignore them. A Check is Mechbase telling you a soft pattern is forming — the cheapest time to look is before it becomes a Warning.
How an item clears#
Items on this list reflect reality, not a separate to-do list you tick off — so you clear them by fixing the underlying condition, and they come off the list on their own. There are two cases:
Sensor-driven items (vibration, temperature, and the like) clear automatically once readings return to normal. Thanks to the averaging logic from Measurements, trends, and alarms, the state lifts when the pattern recovers, not on the first good reading — so a cleared item really means the asset has settled.
Inspection-driven issues (a failed check — a non-conformity) are closed by hand. Open the affected asset, find the item pinned at the top of Activity, deal with the real-world problem, and click Resolve. Add a Resolution comment if it helps (“Topped up with Shell Rimula R4, no leak found”) and click Mark resolved.
Either way, the moment the condition is resolved, the asset drops off Needs attention, the counts tick down, and the change is written to the activity feed (“returned to nominal”, “… resolved by …”) — so there’s a dated record of both the problem and its resolution.
Where it shows up#
You don’t have to go looking for trouble — Mechbase surfaces it wherever you’re already working:
The Needs attention panel on the home page (“N active · M silent”), the full list, and the count badge on the menu.
The warning and critical counts on each section card on the home page.
The state and in alarm count on each asset page.
Dashboards, where an alarmed point’s row is tinted and its section shows the alarm word.
The activity feed, as each state change happens.
Your inbox, if you’ve asked for it (next section).
Getting alerts by email#
Each person decides which alerts reach their inbox, on My Profile → Email notifications (Getting started):
Alert level — be emailed when an asset reaches Check, Warning, or only Critical. The subject says it plainly: “Atlas Copco GA22 is now Warning · LPG Terminal”, with the point and reason inside. When it recovers, everyone who was told about the problem gets “… is back to normal”.
Status changes — also email when a non-conformity is resolved.
Route reports — a summary when a route finishes with open non-conformities (“Monthly Safety & Power Check: 1 non-conformity · LPG Terminal”).
Every member of the site gets these by default at Check and above; anyone can turn them down, pause them, or unsubscribe from the link in any email.