0 · Welcome to Mechbase#
Mechbase keeps track of the health of your plant — every pump, compressor, panel, and motor — so you always know what’s running well, what needs a look, and what needs action right now. This chapter explains what Mechbase is and the few ideas the rest of the manual builds on. If you only read two things first, read What the colours mean and How a site is organised — together they’re the whole mental model.
What Mechbase is#
Mechbase is condition monitoring and inspections in one place. For every piece of equipment you own, it answers one question continuously: is this asset healthy — and if not, how bad is it, and since when?
It does that by bringing together two things that usually live in separate tools:
Automatic measurements from sensors — vibration, temperature, process values, running hours, and full vibration waveforms.
Manual inspections that people carry out on scheduled rounds, with readings, photos, and any problems they find.
Both feed the same picture of your plant and the same health assessment, so what you see on screen is always current — not a spreadsheet someone updates after the fact.
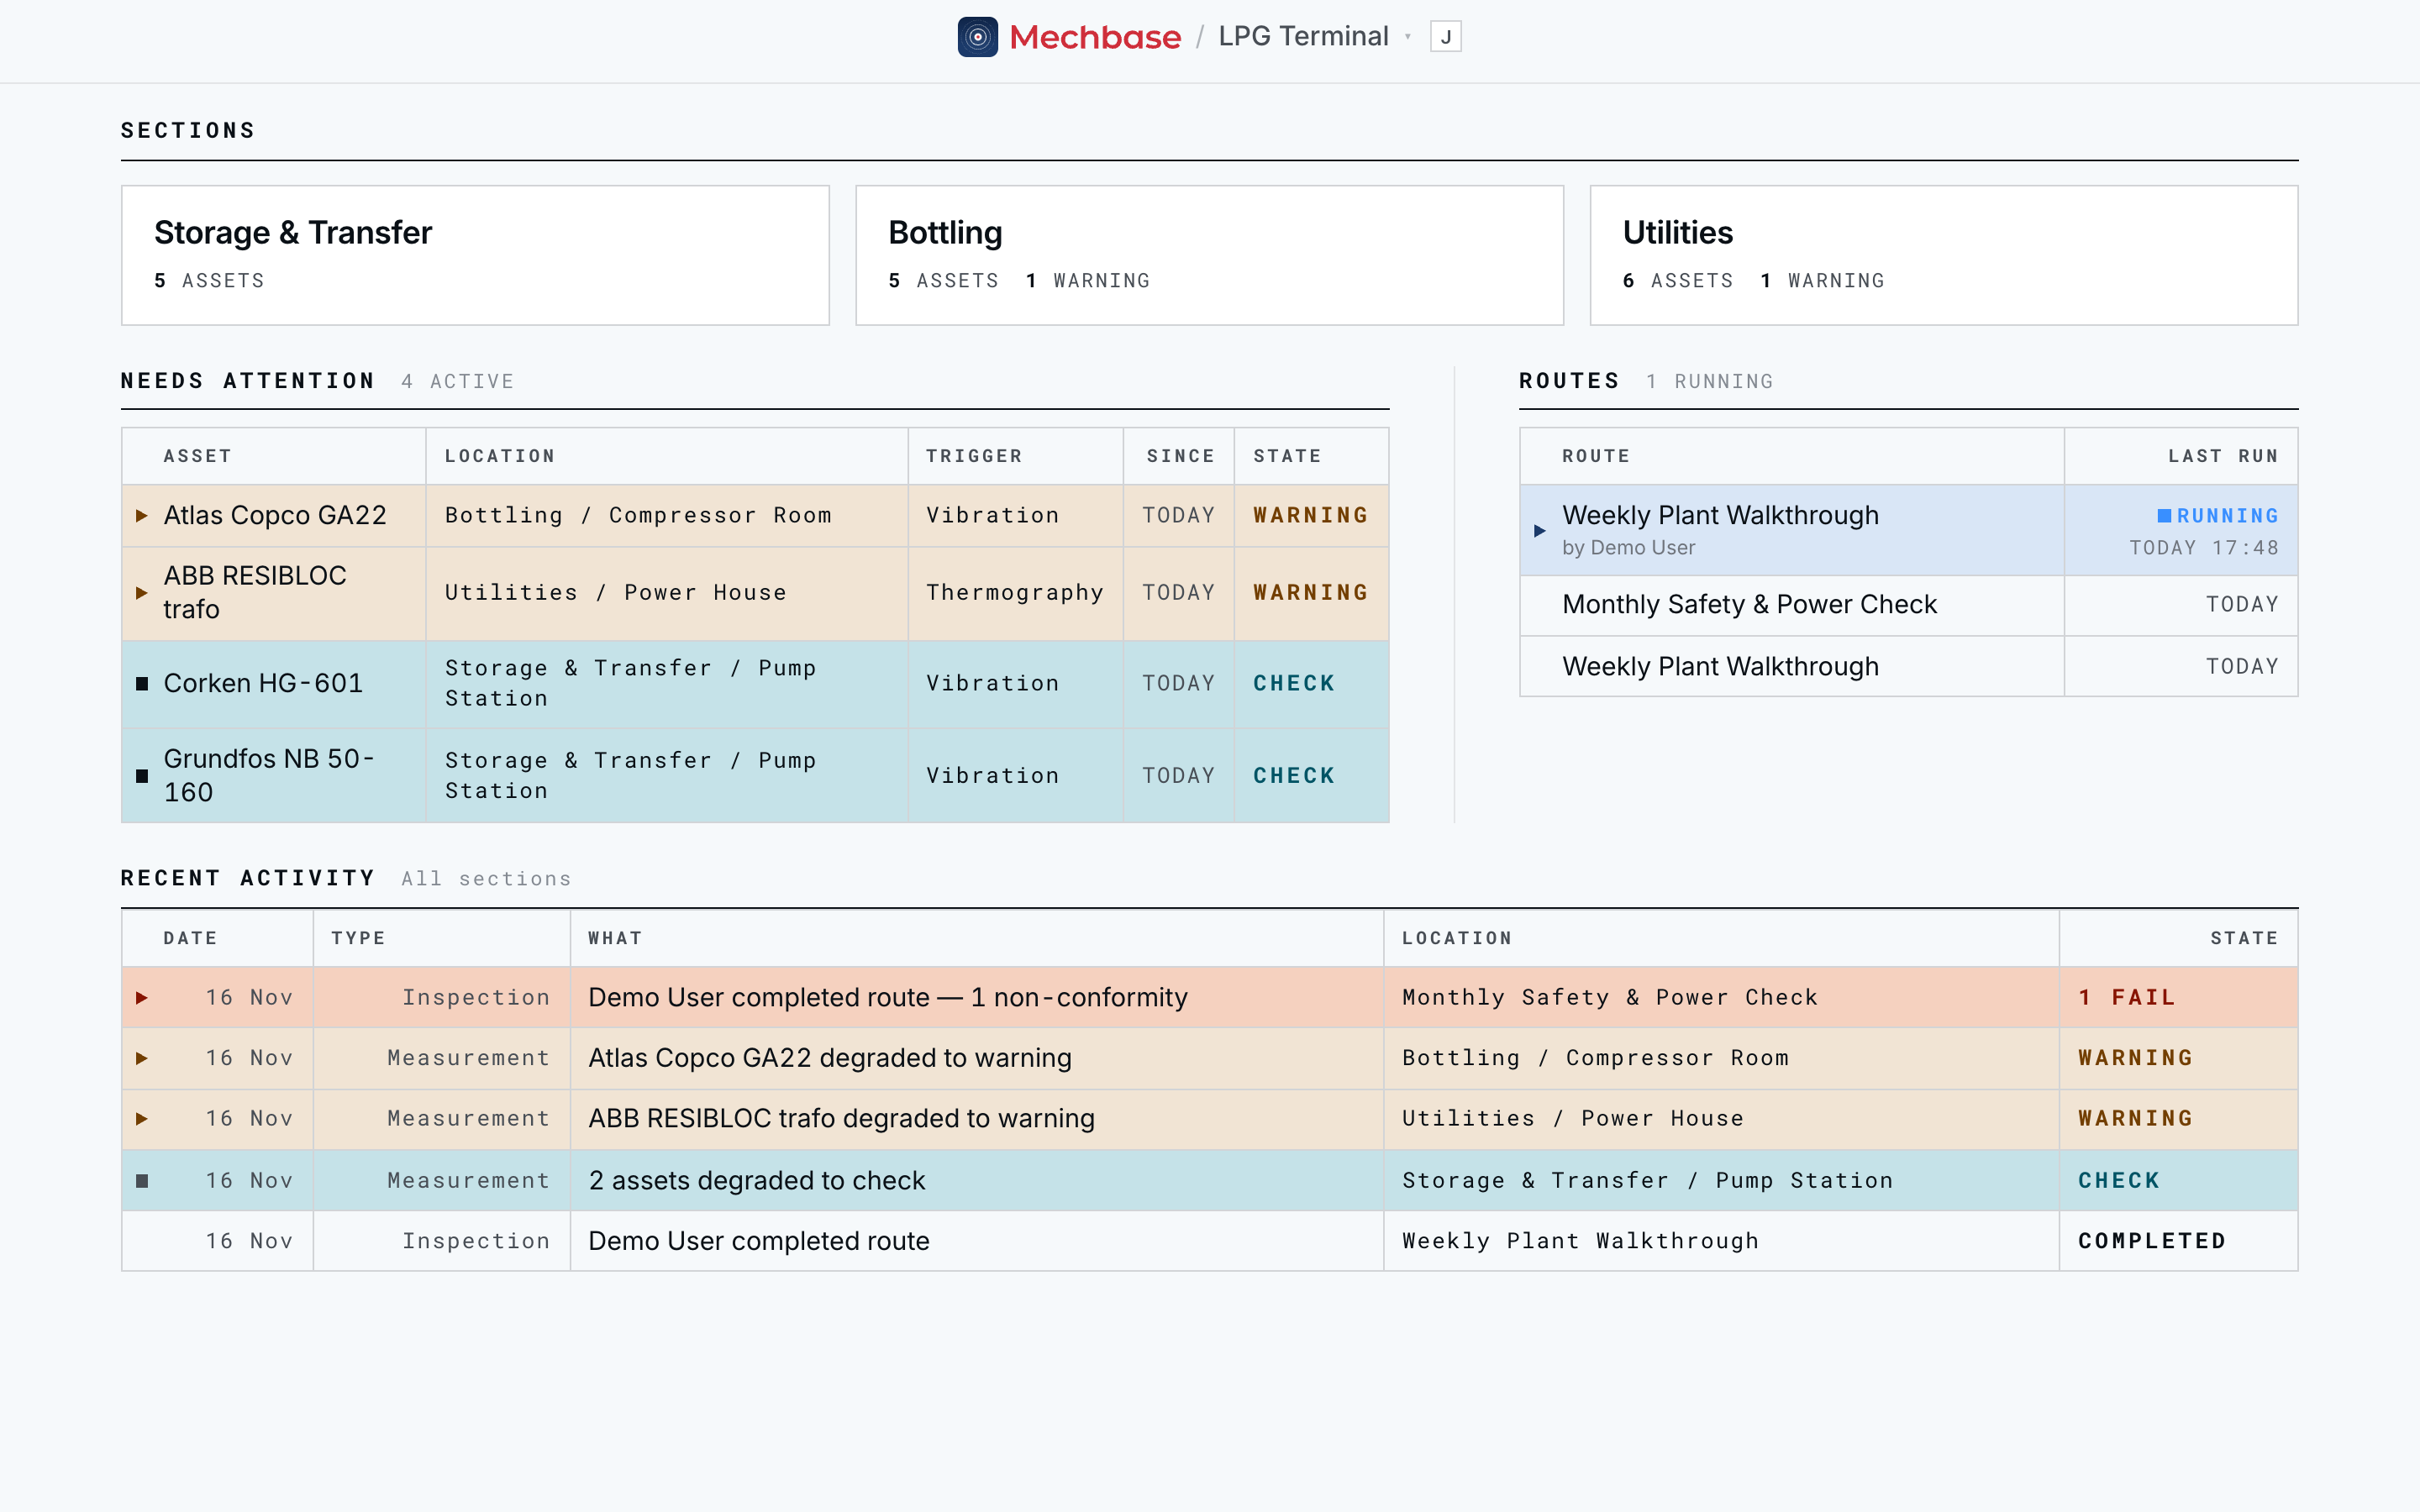
The payoff is that maintenance stops being guesswork. Instead of running equipment to failure or servicing it on a fixed calendar, you act on evidence: the assets that are actually degrading, in priority order.
The Mechbase family#
Mechbase is a small family of connected products, and this manual covers all of them:
Mechbase web — the full system in your browser: the home page, live dashboards, trends and vibration analysis, route building, reports, and setup. It’s where most of this manual lives.
The iOS app — a native field app for technicians: walk routes and capture readings — including thermal images and vibration signatures — right at the machine, even offline. (Mechbase on your phone (iOS & Android))
The Android app — the same native field app on Android. (Mechbase on your phone (iOS & Android))
MaintNode — the edge hardware that measures your equipment automatically and uploads the readings on its own. (MaintNode devices and automatic data)
They all share one backend, so a measurement from a MaintNode device, an inspection logged on Android, and a trend you review on the web are all the same data seen from different places.
Where your data comes from#
Two streams keep an asset’s condition up to date:
Sensors, automatically. MaintNode hardware (or your own devices, over MQTT or the API) measures your equipment and the readings flow into Mechbase on their own. These range from simple values — a temperature, an overall vibration level, whether the machine is running — to full vibration waveforms an analyst can open, filter, and inspect.
Routes, by hand. People walk scheduled inspection routes and record readings, notes, and non-conformities on the mobile apps or the web.
Mechbase treats both the same way: each new piece of data attaches to the right asset, can change that asset’s health, and lands in the activity log.
How a site is organised#
Nearly every screen in Mechbase is a view onto one simple hierarchy. Learn these five words and the whole product becomes predictable:
Installation        a single site — a plant, terminal, factory, or vessel
└── Section         a major area of it            (e.g. Utilities)
    └── Zone        a specific location in it      (e.g. Power House)
        └── Asset   a piece of equipment           (e.g. Caterpillar C9 genset)
            └── Measurement point   what's measured on it, and where
                └── Measurement     one reading, at one moment
A few more terms run across that structure:
Route — a recurring inspection round (like Weekly Plant Walkthrough). Each time someone performs it you get a run (an execution), which may record non-conformities — things found out of spec.
Needs attention — the running list of assets that are no longer healthy, or have gone quiet, and need a look.
Activity — the dated log of every state change, inspection, note, and finding.
Dashboard — a live board of the points you choose to watch, for a control room screen or a quick check.
Everything is referred to by name — sections, zones, and assets by their names,
measurement points by their location on the machine (Motor DE, Pump seal).
Locations read as Section / Zone wherever space allows.
What the colours mean#
Mechbase boils an asset’s condition down to one of four states, coloured the same way on every screen — and always written out as a word too, so you never have to rely on colour alone:
State |
Meaning |
What to do |
|---|---|---|
Nominal |
Healthy — within normal limits. |
Nothing. |
Check |
A soft, early signal that something’s slightly off. |
Keep an eye on it. |
Warning |
Clearly degraded. |
Plan an intervention. |
Critical |
Severe. |
Act now. |
You never set these by hand — Mechbase works them out from measurements and inspections, and timestamps every change. That’s why it can describe an asset’s history in plain words (“degraded to warning”, “returned to nominal”), and why the Needs attention list is a real, current work list rather than someone’s opinion.
Two more markers appear alongside the health states. They describe the data, not the machine:
Silent — an asset whose points used to report but haven’t sent a reading in 30 days, or whose automatic feed has stopped.
Stale — a running-state or device feed that hasn’t checked in recently.
Who sees what#
Access in Mechbase is simple: each person is a member of the installations they work on, and sees those sites and nothing else. The installation picker only lists the sites you belong to.
Inside a site, every member can read and work with everything — trends, routes, notes, setup. A small number of actions are kept for staff accounts (the Mechbase administrators at Arpedon and your designated power users): building dashboards, amending other people’s inspection runs, and deleting equipment that already has recorded history. Who belongs to which site, and who is staff, is set up by an administrator — that’s Setting up and managing your account.
Good to know#
A few things worth knowing if you’re weighing Mechbase up:
Full signals, not just numbers. Mechbase stores complete vibration waveforms, so an analyst can open the time waveform and spectrum of any reading, compare readings side by side, and record a finding against it (Measurements, trends, and alarms).
Running hours, automatically. Mechbase knows when each machine is running — from a tachometer, a run signal, or the vibration itself — and keeps running-hour totals for you.
Your history is durable. A solid SQL data store keeps your measurement history safe and queryable.
It talks to other systems. Mechbase has a REST API, an OData feed for BI tools, an SDK, and a CMMS findings feed, so it can exchange data with your maintenance and analytics tools instead of being a silo. There are pointers in the Appendices and the developer cookbooks.
It tells you by email. Each person chooses which alerts and reports they want emailed (Getting started).
How to read this manual#
This manual covers Mechbase web in depth, with the mobile apps (Mechbase on your phone) and the MaintNode device (MaintNode devices and automatic data) in their own chapters.
Every web screenshot comes from the Mechbase demo data, on the LPG Terminal site. Your own data will look different; the screens won’t.
A few conventions:
Screen and panel names are written as they appear.
Keys look like
K; things you click look like Sign in.Note, Tip, and Heads-up boxes flag things worth catching.
There’s a glossary, a keyboard-shortcut list, and a health-states reference in the Appendices for quick lookups.